|
See my related notes on partitioned Materialized Views here:
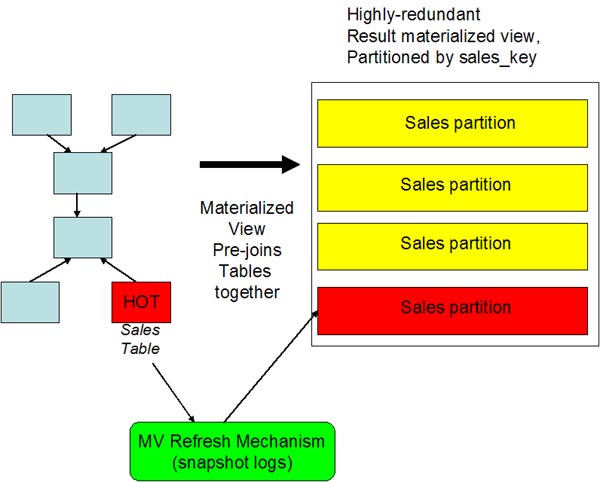
Materialized views are an Oracle Silver Bullet when pre-joining
tables together for super-fast response time.
One issue
with highly-normalized, non-redundant Oracle table designs (e.g. third normal form)
is that Oracle experiences a high degree of overhead (especially
CPU consumption) when
joining dozens of tables together, over-and-over again, and
partitioning may help.
Using materialized views we pre-join the tables together,
resulting in a single, fat, wide and highly-redundant table.

This can reduce logical I/O from tens of
thousands to a single row fetch, resulting in blisteringly fast response
time, but careful attention must be paid to choosing the proper
materialized view partition keys and the best refresh interval.
Without materialized views you may see unnecessary repeating
large-table full-table scans, as summaries are computed, over
and over:

The Oracle 10g
SQL*Access advisor utility advises on recommended
materialized views, but it does not advise us about the proper
method for partitioning the materialization. Here are
directions for
installing basic materialized views. Dr. Arun
Kumar, author of the bestselling book "Easy
Oracle Automation: Oracle10g Automatic Storage, Memory and
Diagnostic Features" also has some excellent advice for
using the Oracle 10g SQLAccess advisor for generating
materialized view suggestions.
The problem with materialized view for
pre-joined tables is keeping them refreshed. Because the
materialized view is built from many tables, and changes to the
base tables require an update to the materialized view.
Remember, If
someone has a row locked for update then you get a consistent
read block from the rollback segment when you read. You aren't
blocked. You just can't see the change until it is committed.
The following
research by Mike Ault illustrates this important technique and
shows how proper partition analyze can allow the Oracle DBA to
de-normalize a schema for high performance without affecting
high volumes of concurrent users.
Oracle Partitioned, Refresh on Commit, Materialized View
Testing
Mike Ault
Burleson Consulting
One of the suggested architectures to allow
for rapid reporting without stressing the base tables is to use
partitioned, refresh on commit, materialized views. While this
has been tested in a single user setup, true stress testing has
not been accomplished. It is hoped this test will help show the
affects of user load on such an architecture.
In order to test this architecture the
Quest Benchmark Factory was utilized with two-main GUI
installations; one to use to perform the INSERT into the base
tables, the other to perform the SELECT activity against the
refresh on commit materialized view. The testing was performed
in three phases:
Phase 1:
In phase one both the INSERT and SELECT
potions of the test were cycled from 1-60 users in 5 user
increments on the INSERT side and 1-30 users in 5 user
increments on the SELECT side simultaneously.
Phase 2:
In phase two the INSERT side was cycled
from 1-60 users in 5 user increments until the response time
exceeded 6 seconds while the SELECT side was run at a constant
user level during the INSERT runs. The SELECT side was run at
constant user levels of 5, 10 and 20 users.
Phase 3:
In phase 3 the materialized view was
recreated as a single table and the constant user level of 20
for SELECTs was used to test the difference between use of
partitions and single tables.
All Phases:
In all phases the SALES table was used for
the update target with ON COMMIT processing for the materialized
views causing selects from all the base tables in the PUBS
schema (SALES, AUTHOR, BOOK, AUTHOR_BOOK, PUBLISHER, STORE) to
publish data into the MV_AUTHOR_SALES materialized view.
Prior to each test the MV_AUTHOR_SALES
materialized view and the SALES table were both truncated.
System Information:
The test system consisted of two laptops
each configured with the Benchmark Factory utility. Laptop 1, a
VIO PCG-GRT250P with 1 gigabyte of memory and a 2.8 Ghz Pentium
IV processor and a 1 GBit Enet card was used for running the
INSERT processing. Laptop 2, a Gateway 9300 with a 400 Mhz PII
processor and 700 Megabytes of memory with a 100 Mbit Enet card
was used for the SELECT processing.
The database server is a Redhat Linux based
3.0 Ghz Pentium IV with hyperthreading and 2 Gigabytes of memory
running Oracle Enterprise 10gR2 10.1.0.3 release. The server is
direct attached through Fast-Wide SCSI to a 8 disk NStore disk
array using all 8-19 Gigabyte 10K rpm drives in a RAID5 array.
This architecture is shown in Figure 1.

Figure 1: Test
Architecture
Details of the Architecture are as follows:
OS Version:
[oracle@aultlinux3 ~]$ uname -a
Linux
aultlinux3 2.6.9-5.ELsmp #1 SMP Wed Jan 5 19:30:39 EST 2005 i686
i686 i386 GNU/Linux
CPU (One 3 Ghz, hyperthreading)
[oracle@aultlinux3 proc]$ more cpuinfo
processor : 0
vendor_id : GenuineIntel
cpu family : 15
model : 2
model name : Intel(R) Pentium(R) 4 CPU 3.00GHz
stepping : 9
cpu MHz : 2998.822
cache size : 512 KB
physical id : 0
siblings : 2
fdiv_bug : no
hlt_bug : no
f00f_bug : no
coma_bug : no
fpu : yes
fpu_exception : yes
cpuid level : 2
wp : yes
flags : fpu vme de pse tsc msr pae mce cx8 apic
mtrr pge mca cmov pat pse36 clflush dts acpi mmx fxsr sse
sse2 ss ht tm pb
e cid xtpr
bogomips : 5914.62
processor : 1
vendor_id : GenuineIntel
cpu family : 15
model : 2
model name : Intel(R) Pentium(R) 4 CPU 3.00GHz
stepping : 9
cpu MHz : 2998.822
cache size : 512 KB
physical id : 0
siblings : 2
fdiv_bug : no
hlt_bug : no
f00f_bug : no
coma_bug : no
fpu : yes
fpu_exception : yes
cpuid level : 2
wp : yes
flags : fpu vme de pse tsc msr pae mce cx8 apic
mtrr pge mca cmov pat pse36 clflush dts acpi mmx fxsr sse
sse2 ss ht tm pb
e cid xtpr
bogomips : 5980.16
Memory:
[oracle@aultlinux3 proc]$ more meminfo
MemTotal: 2074236 kB
MemFree: 11492 kB
Buffers: 98872 kB
Cached: 1605096 kB
SwapCached: 72 kB
Active: 1532024 kB
Inactive: 397312 kB
HighTotal: 1178816 kB
HighFree: 1536 kB
LowTotal: 895420 kB
LowFree: 9956 kB
SwapTotal: 2031608 kB
SwapFree: 2031456 kB
Dirty: 132 kB
Writeback: 0 kB
Mapped: 968348 kB
Slab: 67264 kB
Committed_AS: 2212852 kB
PageTables: 45360 kB
VmallocTotal: 106488 kB
VmallocUsed: 4040 kB
VmallocChunk: 102360 kB
HugePages_Total: 0
HugePages_Free: 0
Hugepagesize: 2048 kB
RAID:
This is a NStore SCSI attached 8 Disk Array
[root@aultlinux3 ~]# mdadm -Q --detail /dev/md0
/dev/md0:
Version : 00.90.01
Creation Time : Mon May 9 14:32:32 2005
Raid Level : raid5
Array Size : 124479488 (118.71 GiB 127.47 GB)
Device Size : 17782784 (16.96 GiB 18.21 GB)
Raid Devices : 8
Total Devices : 8
Preferred Minor : 0
Persistence : Superblock is persistent
Update Time : Sun Mar 12 11:01:19 2006
State : clean
Active Devices : 8
Working Devices : 8
Failed Devices : 0
Spare Devices : 0
Layout : left-symmetric
Chunk Size : 1024K
Number Major Minor RaidDevice State
0 8 16 0 active sync /dev/sdb
1 8 32 1 active sync
/dev/sdc
2 8 48 2 active sync
/dev/sdd
3 8 64 3 active sync
/dev/sde
4 8 80 4 active sync
/dev/sdf
5 8 96 5 active sync
/dev/sdg
6 8 112 6 active sync
/dev/sdh
7 8 128 7 active sync
/dev/sdi
UUID : cadfa665:da15b8cc:95ee2807:a4dd69b3
Events : 0.260263
Oracle:
BANNER
----------------------------------------------------------------
Oracle Database 10g Enterprise Edition Release 10.1.0.3.0 -
Prod
PL/SQL Release 10.1.0.3.0 - Production
CORE 10.1.0.3.0 Production
TNS for Linux: Version 10.1.0.3.0 - Production
NLSRTL Version 10.1.0.3.0 - Production
Network: Ethernet through Hubs and Nics
All
networks 1 GHZ or minimum of 100 Mghz
Database Objects
The database utilizes a base set of tables,
SALES, AUTHOR, BOOK, AUTHOR_BOOK, STORE and PUBLISHER. These
tables are used to create a REFRESH-ON-COMMIT materialized view
constructed on top of an existing partitioned table.
Details of Materialized View:
The script used to create the materialized
view base table is shown in Figure 2.
drop materialized view mv_author_sales;
drop table mv_author_sales;
truncate table sales;
CREATE TABLE mv_author_sales
PARTITION BY RANGE (order_date)
(PARTITION p1 VALUES LESS THAN (to_date('012002','mmyyyy')),
PARTITION p2 VALUES LESS THAN (to_date('022002','mmyyyy')),
PARTITION p3 VALUES LESS THAN (to_date('032002','mmyyyy')),
PARTITION p4 VALUES LESS THAN (to_date('042002','mmyyyy')),
PARTITION p5 VALUES LESS THAN
(to_date('052002','mmyyyy')),
PARTITION p6 VALUES LESS THAN
(to_date('062002','mmyyyy')),
PARTITION p7 VALUES LESS THAN
(to_date('072002','mmyyyy')),
PARTITION p8 VALUES LESS THAN
(to_date('082002','mmyyyy')),
PARTITION p9 VALUES LESS THAN
(to_date('092002','mmyyyy')),
PARTITION p10 VALUES LESS THAN
(to_date('102002','mmyyyy')),
PARTITION p11 VALUES LESS THAN
(to_date('112002','mmyyyy')),
PARTITION p12 VALUES LESS THAN
(to_date('122002','mmyyyy')),
PARTITION p13 VALUES LESS THAN (MAXVALUE))
as
(Select d.order_date,
a.rowid idrowa, b.rowid idrowb, c.rowid idrowc,
d.rowid idrowd, e.rowid idrowe, f.rowid idrowf,
a.author_last_name, a.author_first_name,f.pub_name,
a.author_contract_nbr,
e.store_state,d.quantity
From author a, book_author b, book c, sales d, store e,
publisher f
Where a.author_key=b.author_key
And b.book_key=c.book_key And c.book_key=d.book_key
And e.store_key=d.store_key
and c.pub_key=f.pub_key)
/
create index mv_rida on mv_author_sales(idrowa);
create index mv_ridb on mv_author_sales(idrowb);
create index mv_ridc on mv_author_sales(idrowc);
create index mv_ridd on mv_author_sales(idrowd);
create index mv_ride on mv_author_sales(idrowe);
create index mv_ridf on mv_author_sales(idrowf);
Figure 2:
Script to Create Partitioned Table
Once the base table is created, the
materialized view is defined on the existing table. The script
to create the materialized view is shown in Figure 3.
Create materialized view mv_author_sales
on prebuilt table
Refresh on commit
as
Select d.order_date,a.rowid idrowa, b.rowid idrowb, c.rowid
idrowc, d.rowid idrowd, e.rowid idrowe, f.rowid idrowf,
a.author_last_name, a.author_first_name,f.pub_name,
a.author_contract_nbr,
e.store_state,d.quantity
From author a, book_author b, book c, sales d, store e,
publisher f
Where a.author_key=b.author_key
And b.book_key=c.book_key And c.book_key=d.book_key
And e.store_key=d.store_key
and c.pub_key=f.pub_key
/
Figure 3:
Materialized View Creation Script
After creation and refresh the
MV_AUTHOR_SALES and SALES tables we analyzed using a command
similar to:
dbms_stats.gather_table_stats('PUBS','MV_AUTHOR_SALES',cascade=>true);
The dynamic sampling feature of 10g was
utilized to maintain statitistics for the test since the table
and materialized view were growing during the entire test period
for each test.
Transaction Details:
Two basic transactions were utilized to
test the affect of locking on the INSERT and SELECT activities.
The SALES table formed the base of the materialized view
MV_AUTHOR_SALES so the INSERT transaction focused on inserts
into the SALES table. The inserts into the SALES table force the
materialized view refresh (REFRESH-ON-COMMT) to select records
from all of the base tables. The following Benchmark Factory
function scripts where used to populate random values into the
INSERT statement:
- $BFRandList - Insert one of the
provided list into the statement at this point with
frequency based on the provided integer ("val":f) if no
integer is provided, use 1.
- $BFRandRange - Insert a random
integer in the range specified.
- $BFDate - Insert a random date
in the range specified.
Insert Transaction:
insert into sales values (
'$BFRandList("S101","S103","S103","S104","S105","S106","S107","S108",
"S109","S110")',
'$BFRandList("B101","B102","B103","B104","B105","B106","B107","B108","B109","B110","B111","B112","B113","B114","B115","B116")',
'O'||to_char(order_number.nextval),
to_date('$BFDate("01/01/2002","12/31/2002")','mm/dd/yyyy'),
$BFRandRange(1,100));
The SELECT transaction was designed to
fully access the materialized view placing the most stress on
the view as possible.
Select Transaction:
select
to_number(to_char(order_date,'mmyyyy'))
month_of_sales,
author_first_name,author_last_name,sum(quantity)
from
mv_author_sales
group by
to_number(to_char(order_date,'mmyyyy')),author_first_name,author_last_name;
Using the INSERT with the Benchmark Factory
script functions provided a distribution of values similar to
the following example
distribution in all the tests.
PARTITION COUNT(*)
--------- ----------
012002 831
022002 765
032002 805
042002 799
052002 885
062002 788
072002 896
082002 864
092002 871
102002 843
112002 888
122002 857
The next sections show the
results from the three phases of testing.
Phase 1: Both Insert and
Select Varying
In phase one, both
Benchmark Factory tests were made to scale. From 1-30 users
for selects in 5 user increments (1, 5, 10, 15, 20, 25, 30)
and 1-60 users in inserts in 5 user increments. During
testing locks were monitored using the procedure shown in
Figure 4.
Create or replace procedure
get_locks(tim_in_min number) as
interations number;
I integer;
begin
interations:=floor(tim_in_min*60/4)+1;
for I in 1..interations
loop
insert into
perm4_object_locks
select sysdate,
b.object_name,count(*)
from v$locked_object a,
dba_objects b
where
a.object_id=b.object_id
and
object_name!='PERM4_OBJECT_LOCKS'
group by object_name;
commit;
dbms_lock.sleep(4);
end loop;
end;
Figure 4:
Lock Monitoring Procedure
The locking was monitored at 4 second
intervals and the results for Phase 1, 1-30 User SELECT
processes in 5 user increments versus INSERT processing at 1-60
users in 5 user increments.
Lock profile for MV_AUTHOR_SALES
materialized view:
MEAS_ OBJECT_NAME SUM(NUM_LOCKS)
----- --------------- --------------
21:10 MV_AUTHOR_SALES 2
21:11 MV_AUTHOR_SALES 4
21:12 MV_AUTHOR_SALES 2
21:13 MV_AUTHOR_SALES 2
21:14 MV_AUTHOR_SALES 4
21:17 MV_AUTHOR_SALES 2
21:18 MV_AUTHOR_SALES 2
21:19 MV_AUTHOR_SALES 2
21:21 MV_AUTHOR_SALES 3
21:22 MV_AUTHOR_SALES 4
21:23 MV_AUTHOR_SALES 2
21:25 MV_AUTHOR_SALES 2
The INSERT side of the test results are
shown in Figure 5.
|
Overall Results |
|
|
|
|
|
|
Userload |
Test Phase |
TPS |
Avg Time |
Min Time |
Max Time |
90th Time |
|
1 |
1 |
6.02 |
0.165 |
0.098 |
0.316 |
0.213 |
|
5 |
1 |
4.41 |
1.133 |
0.534 |
3.361 |
1.535 |
|
10 |
1 |
3.02 |
3.306 |
1.993 |
5.377 |
3.922 |
|
15 |
1 |
2.24 |
6.684 |
3.534 |
22.143 |
11.004 |


Figure 5:
Results for INSERT Test
The results for the SELECT test of Phase 1
are shown in Figure 6.
|
General Information |
|
|
|
|
|
Run Information |
|
Test
Run Id |
11 |
Status |
Completed |
|
Start Time |
3/10/2006 21:01 |
Stop
Time |
3/10/2006 21:29 |
|
Comment |
SELECT 1-30 by 5 |
|
|
|
|
|
|
|
|
Profile Information |
|
Profile Name |
aultdb2 |
|
Driver |
Oracle |
|
Net
Service Name |
Hfdwh |
|
Tablespace |
Users |
|
User
Name |
Pubs |
|
Password |
****** |
|
|
|
|
|
|
|
|
|
|
|
|
|
|
Test Information |
|
Name: |
Max
TPS (1-30 by 5) |
|
Test
Type: |
Mixed Workload Database Test |
|
Test
Id: |
2 |
Version |
4 |
|
|
Overall Results |
|
|
|
|
|
|
|
|
|
User load |
Test Phase |
TPS |
BPS |
BPS |
Bytes |
Avg Time |
Min Time |
Max Time |
90th Time |
|
1 |
1 |
3.34 |
22332.41 |
57792 |
4021933 |
0.298 |
0.23 |
0.64 |
0.334 |
|
5 |
1 |
8.69 |
58087.98 |
150240 |
10465619 |
0.575 |
0.346 |
0.935 |
0.676 |
|
10 |
1 |
12.04 |
80591.34 |
208032 |
14507472 |
0.829 |
0.393 |
1.627 |
1.005 |
|
15 |
1 |
13.42 |
89836.41 |
231168 |
16124024 |
1.116 |
0.401 |
2.916 |
1.457 |
|
20 |
1 |
15.67 |
104949.1 |
270528 |
18872146 |
1.274 |
0.594 |
2.758 |
1.565 |
|
25 |
1 |
16.04 |
107416.6 |
277248 |
19340936 |
1.556 |
0.84 |
3.672 |
2.014 |
|
30 |
1 |
16.09 |
107763.9 |
277344 |
19347633 |
1.862 |
0.923 |
6.392 |
2.469 |
Figure 6:
Select Test Results
The results show that the locking affects
INSERT processing resulting in the average time for inserts to
increase to greater than 6 seconds within 15 user processes
while SELECT processing shows little affect other than that
which can be expected from the materialized view table size
increase. However, the affects are hard to characterize when
both INSERT and SELECT processes are varying.
Phase 1 Results Summary
The results show that the locking affects
INSERT processing resulting in the average time for inserts to
increase to greater than 6 seconds within 15 user processes
while SELECT processing shows little affect other than that
which can be expected from the materialized view table size
increase. However, the affects are hard to characterize when
both INSERT and SELECT processes are varying.
Phase 2: Keep SELECT transaction level constant (5,10,20),
check TPS and response for Inserts (1-60 or where Response >6
sec)
In Phase 2 testing the number of SELECT
user processes is kept constant while the number of INSERT
processes is increase in 5 user intervals until response time
increase above 6 seconds. SELECT user levels of 5, 10 and 20
were used. The TPS and response time for the SELECT processes
were recorded at each user level for each upward increment in
the numbe of INSERT processes to gauge the affect of increased
locking on the SELECT processing.
5 concurrent SELECTS
With 1, 5, 10, 15, 20, 25, 30 INSERT
operations at 4-5 minute interval ramp recorded >3 sec response
at 20 users, >6 sec response at 30 users test was halted when
insert processing reached >6 seconds transaction time. The
results for the INSERT processing are shown in Figure 7.
|
General
Information |
|
|
|
|
|
Run Information |
|
|
|
|
|
Test Run Id |
78 |
|
Status |
Completed |
|
Start Time |
3/11/2006
20:50 |
|
Stop Time |
3/11/2006 21:19 |
|
Comment |
5 Selects |
|
|
|
|
|
|
|
|
|
|
Profile Information |
|
|
|
|
|
Profile Name |
aultdb2 |
|
|
|
|
Driver |
ODBC |
|
|
|
|
Data Source Name |
hfdwh |
|
|
|
|
User Name |
pubs |
|
|
|
|
Password |
****** |
|
|
|
|
Userload |
Test Phase |
TPS |
Avg Time |
Min Time |
Max Time |
90th Time |
|
1 |
1 |
5.79 |
0.172 |
0.113 |
0.287 |
0.225 |
|
5 |
1 |
6.29 |
0.795 |
0.517 |
2.675 |
0.978 |
|
10 |
1 |
4.32 |
2.315 |
1.262 |
7.888 |
3.732 |
|
15 |
1 |
5.56 |
2.699 |
1.798 |
3.97 |
3.243 |
|
20 |
1 |
5.43 |
3.681 |
2.572 |
5.699 |
4.37 |
|
25 |
1 |
5.01 |
4.993 |
3.439 |
10.602 |
5.672 |
|
30 |
1 |
4.82 |
6.23 |
4.471 |
30.898 |
9.358 |

Figure 7:
Results from 5 Select processes on Inserts
The resulting lock profile from the inserts
is shown in Figure 8.
MEAS_ OBJECT_NAME SUM(NUM_LOCKS)
----- --------------- --------------
20:50 MV_AUTHOR_SALES 6
20:51 MV_AUTHOR_SALES 6
20:52 MV_AUTHOR_SALES 4
20:53 MV_AUTHOR_SALES 2
20:54 MV_AUTHOR_SALES 6
20:55 MV_AUTHOR_SALES 6
20:56 MV_AUTHOR_SALES 6
20:58 MV_AUTHOR_SALES 2
20:59 MV_AUTHOR_SALES 2
21:00 MV_AUTHOR_SALES 1
21:01 MV_AUTHOR_SALES 4
21:02 MV_AUTHOR_SALES 4
21:03 MV_AUTHOR_SALES 4
21:04 MV_AUTHOR_SALES 4
21:05 MV_AUTHOR_SALES 2
21:06 MV_AUTHOR_SALES 2
21:07 MV_AUTHOR_SALES 4
21:08 MV_AUTHOR_SALES 2
21:09 MV_AUTHOR_SALES 4
21:10 MV_AUTHOR_SALES 2
21:11 MV_AUTHOR_SALES 6
21:12 MV_AUTHOR_SALES 2
21:13 MV_AUTHOR_SALES 2
21:14 MV_AUTHOR_SALES 4
21:15 MV_AUTHOR_SALES 5
21:16 MV_AUTHOR_SALES 2
21:17 MV_AUTHOR_SALES 2
21:18 MV_AUTHOR_SALES 6
Figure 8:
Lock Profile for Test
10 concurrent SELECTS
With 1, 5, 10, 15, 20, 25, 30 INSERT
operations at 4-5 minute interval ramp recorded >3 sec response
at 20 users, >6 sec response at 30 users test was halted when
insert processing reached >6 seconds transaction time. The
results for the INSERT processing are shown in Figure 9.
|
General
Information |
|
|
|
|
|
Run Information |
|
|
|
|
|
Test Run Id |
73 |
|
Status |
Completed |
|
Start Time |
3/11/2006 18:59 |
|
Stop Time |
3/11/2006 19:28 |
|
Comment |
10 Selects |
|
|
|
|
|
|
|
|
|
|
Profile Information |
|
|
|
|
|
Profile Name |
aultdb2 |
|
|
|
|
Driver |
ODBC |
|
|
|
|
Data Source Name |
hfdwh |
|
|
|
|
User Name |
pubs |
|
|
|
|
Password |
****** |
|
|
|
|
|
|
|
|
|
|
|
|
|
|
|
|
|
|
|
|
|
|
Userload |
Test Phase |
TPS |
Avg Time |
Min Time |
Max Time |
90th Time |
|
1 |
1 |
5.44 |
0.183 |
0.118 |
0.293 |
0.238 |
|
5 |
1 |
6.02 |
0.83 |
0.543 |
2.688 |
1.006 |
|
10 |
1 |
5.51 |
1.814 |
1.203 |
3.043 |
2.287 |
|
15 |
1 |
5.12 |
2.93 |
1.946 |
5.013 |
3.547 |
|
20 |
1 |
4.9 |
4.077 |
2.774 |
9.723 |
4.858 |
|
25 |
1 |
4.4 |
5.678 |
3.837 |
20.626 |
7.881 |
|
30 |
1 |
4.07 |
7.369 |
4.753 |
40.996 |
12.639 |
Figure 9:
Results from 10 SELECT Users on INSERTs
The resulting lock profile from the inserts
is shown in Figure 10.
MEAS_ OBJECT_NAME SUM(NUM_LOCKS)
----- --------------- --------------
18:59 MV_AUTHOR_SALES 4
19:00 MV_AUTHOR_SALES 2
19:02 MV_AUTHOR_SALES 8
19:04 MV_AUTHOR_SALES 5
19:05 MV_AUTHOR_SALES 2
19:06 MV_AUTHOR_SALES 4
19:07 MV_AUTHOR_SALES 4
19:08 MV_AUTHOR_SALES 4
19:09 MV_AUTHOR_SALES 4
19:10 MV_AUTHOR_SALES 6
19:12 MV_AUTHOR_SALES 4
19:13 MV_AUTHOR_SALES 4
19:15 MV_AUTHOR_SALES 6
19:16 MV_AUTHOR_SALES 4
19:18 MV_AUTHOR_SALES 2
19:19 MV_AUTHOR_SALES 4
19:20 MV_AUTHOR_SALES 2
19:21 MV_AUTHOR_SALES 2
19:22 MV_AUTHOR_SALES 6
19:24 MV_AUTHOR_SALES 2
19:25 MV_AUTHOR_SALES 2
19:26 MV_AUTHOR_SALES 4
19:27 MV_AUTHOR_SALES 2
Figure 10:
Lock Profile for Test
12 concurrent SELECTS
With 1, 5, 10, 15, 20, 25 INSERT operations
at 4-5 minute interval ramp recorded >3 sec response at 15
users, >6 sec response at 25 users test was halted when insert
processing reached >6 seconds transaction time. The results for
the INSERT processing are shown in Figure 11.
|
General
Information |
|
|
|
|
|
Run Information |
|
|
|
|
|
Test Run Id |
76 |
|
Status |
Completed |
|
Start Time |
3/11/2006 19:51 |
|
Stop Time |
3/11/2006 20:16 |
|
Comment |
20 Selects |
|
|
|
|
|
|
|
|
|
|
Profile Information |
|
|
|
|
|
Profile Name |
aultdb2 |
|
|
|
|
Driver |
ODBC |
|
|
|
|
Data Source Name |
hfdwh |
|
|
|
|
User Name |
pubs |
|
|
|
|
Password |
****** |
|
|
|
|
Userload |
Test Phase |
TPS |
Avg Time |
Min Time |
Max Time |
90th Time |
|
1 |
1 |
5.12 |
0.195 |
0.123 |
0.52 |
0.249 |
|
5 |
1 |
6.02 |
0.829 |
0.491 |
3.122 |
1.032 |
|
10 |
1 |
5.4 |
1.852 |
1.214 |
2.992 |
2.296 |
|
15 |
1 |
4.93 |
3.042 |
2.027 |
5.43 |
3.613 |
|
20 |
1 |
4.53 |
4.418 |
2.929 |
9.93 |
5.168 |
|
25 |
1 |
3.86 |
6.47 |
4.015 |
31.277 |
10.115 |

Figure 11:
Results from 20 SELECT Users on INSERTs
The resulting lock profile from the inserts
is shown in Figure 12.
MEAS_ OBJECT_NAME SUM(NUM_LOCKS)
----- --------------- --------------
19:52 MV_AUTHOR_SALES 2
19:53 MV_AUTHOR_SALES 4
19:55 MV_AUTHOR_SALES 2
19:56 MV_AUTHOR_SALES 6
19:57 MV_AUTHOR_SALES 6
19:58 MV_AUTHOR_SALES 4
20:00 MV_AUTHOR_SALES 4
20:01 MV_AUTHOR_SALES 4
20:02 MV_AUTHOR_SALES 4
20:04 MV_AUTHOR_SALES 4
20:05 MV_AUTHOR_SALES 4
20:07 MV_AUTHOR_SALES 4
20:08 MV_AUTHOR_SALES 4
20:09 MV_AUTHOR_SALES 2
20:11 MV_AUTHOR_SALES 8
20:13 MV_AUTHOR_SALES 2
20:14 MV_AUTHOR_SALES 2
17 rows selected.
Figure 12:
Lock Profile for Test
Phase 2 Summary
Over all the Phase 2 testing shows that
locking has little or no affect on SELECT operations while the
number of SELECT processes has an affect on the number of INSERT
processes capable of operating with a less than 6 second
response time and the number of TPS that can be processed for
that user level.
Phase 3: Materialized View With No Partitions
In Phase three the affect of utilizing a
single base table verses using multiple partitions at the
maximum number of SELECT processes (20) is measured. The scripts
used for this test are shown in Figure 13.
CREATE TABLE mv_author_sales
as
(Select
d.order_date,
a.rowid idrowa,
b.rowid idrowb,
c.rowid idrowc,
d.rowid idrowd,
e.rowid idrowe,
f.rowid idrowf,
a.author_last_name,
a.author_first_name,
f.pub_name,
a.author_contract_nbr,
e.store_state,d.quantity
From
author a,
book_author b,
book c,
sales d,
store e,
publisher f
Where
a.author_key=b.author_key
and b.book_key=c.book_key
and c.book_key=d.book_key
and e.store_key=d.store_key
and c.pub_key=f.pub_key)
create index mv_rida on mv_author_sales(idrowa);
create index mv_ridb on mv_author_sales(idrowb);
create index mv_ridc on mv_author_sales(idrowc);
create index mv_ridd on mv_author_sales(idrowd);
create index mv_ride on mv_author_sales(idrowe);
create index mv_ridf on mv_author_sales(idrowf);
Create materialized view mv_author_sales
on prebuilt table
Refresh on commit
as
Select d.order_date,a.rowid idrowa,
b.rowid idrowb, c.rowid idrowc, d.rowid idrowd,
e.rowid idrowe, f.rowid idrowf, a.author_last_name,
a.author_first_name,f.pub_name,
a.author_contract_nbr,
e.store_state,d.quantity
From author a, book_author b, book c, sales d, store e,
publisher f
Where a.author_key=b.author_key
And b.book_key=c.book_key And c.book_key=d.book_key
And e.store_key=d.store_key
and c.pub_key=f.pub_key
/
Truncate sales and mv_author_sales
exec
dbms_stats.gather_table_stats('PUBS','MV_AUTHOR_SALES',cascade=>true);
Figure 13:
Scripts Used to Create Single Table Materialized View
The Phase 3 results for the INSERT
processes are shown in Figure 14.
|
General Information |
|
|
|
|
|
Run Information |
|
Test
Run Id |
79 |
Status |
Completed |
|
Start Time |
3/12/2006 11:13 |
Stop
Time |
3/12/2006 0:02 |
|
Comment |
Non-Part table 20 concurrent SELECTS |
|
|
|
|
|
|
|
|
Profile Information |
|
Profile Name |
aultdb2 |
|
Driver |
ODBC |
|
Data
Source Name |
hfdwh |
|
User
Name |
pubs |
|
Password |
****** |
|
|
|
|
Test Information |
|
Name: |
Response < 6000 ms (1-60 by 5) |
|
Test
Type: |
Mixed Workload Database Test |
|
Test
Id: |
5 |
Version |
12 |
|
|
Userload |
Test Phase |
TPS |
Avg Time |
Min Time |
Max Time |
90th Time |
|
1 |
1 |
5 |
0.199 |
0.114 |
0.857 |
0.254 |
|
5 |
1 |
5.96 |
0.838 |
0.499 |
2.671 |
1.033 |
|
10 |
1 |
5.21 |
1.919 |
1.203 |
4.221 |
2.394 |
|
15 |
1 |
4.97 |
3.017 |
2.08 |
4.947 |
3.663 |
|
20 |
1 |
4.66 |
4.287 |
2.963 |
9.9 |
5.136 |
|
25 |
1 |
4.18 |
5.975 |
3.881 |
25.745 |
8.7 |
|
30 |
1 |
3.66 |
8.206 |
4.744 |
66.935 |
15.143 |
Figure 13:
Results from 20 SELECT Users on INSERTs With No Partitioning
The resulting lock profile from the inserts
is shown in Figure 14.
TIME OBJECT_NAME NUM_LOCKS
----- ---------------- ----------
11:33 MV_AUTHOR_SALES 1
11:35 MV_AUTHOR_SALES 3
11:36 MV_AUTHOR_SALES 2
11:37 MV_AUTHOR_SALES 3
11:38 MV_AUTHOR_SALES 2
11:40 MV_AUTHOR_SALES 1
11:41 MV_AUTHOR_SALES 2
11:42 MV_AUTHOR_SALES 2
11:43 MV_AUTHOR_SALES 3
11:44 MV_AUTHOR_SALES 2
11:45 MV_AUTHOR_SALES 1
11:46 MV_AUTHOR_SALES 1
11:48 MV_AUTHOR_SALES 1
11:49 MV_AUTHOR_SALES 2
11:50 MV_AUTHOR_SALES 2
11:51 MV_AUTHOR_SALES 3
11:53 MV_AUTHOR_SALES 2
11:55 MV_AUTHOR_SALES 1
11:56 MV_AUTHOR_SALES 1
11:57 MV_AUTHOR_SALES 2
11:58 MV_AUTHOR_SALES 1
11:59 MV_AUTHOR_SALES 3
12:00 MV_AUTHOR_SALES 1
12:01 MV_AUTHOR_SALES 3
12:02 MV_AUTHOR_SALES 1
Figure 14:
Lock Profile for Test
The total row count for the single table
test was 9299 vice 10092 in the partitioned testing (on the
average.) The distribution of the values in the single table is
shown in Figure 15.
ORDER COUNT(*)
------ ----------
012002 786
022002 692
032002 733
042002 737
052002 810
062002 722
072002 828
082002 803
092002 803
102002 781
112002 824
122002 780
12 rows selected.
Figure 15:
Inserted Value Distribution
Phase 3 Summary
Phase 3 shows that while partitions are
good for SELECT processing they may have a slightly detrimental
affect on INSERT processing. The INSERT processing affects may
be mitigated by changing how rows are stored in the table such
as by large PCTFREE allocations limiting the rows per block.
Combined Results
It is easer to see the affects of the
increasing number of SELECT processes by combining the results
from the various tests into a series of graphs. In the first
graph we examine the affect on transactions per second (TPS).
Figure 16 shows the combined TPS graphs for the 5, 10, 20 SELECT
Users and the 20 SELECT users with no partitions test results.
Notice how the performance for the 20 SELECT user no partitions
TPS is less than for the 20 SELECT user partitioned results. All
of the other results show the affect of the increase stress of
the SELECT processing on the INSERT users and the lack of affect
of the INSERT processes on the SELECT users.

Figure 16:
Combined TPS Results
In the next figure, Figure 17, the results
from the response times for the SELECT processes as the number
of INSERT processes increased a is shown for each of the
constant process levels (5,10,20 and 20 with no partitioning.)
In Figure 17 we can see that after an initial drop off, the
response times showed only marginal reductions which can
probably be accredited to the increasing size of the
materialized view.

Figure 17:
Combined Response Time Results
Figure 18 shows the combined results for
the INSERT processing TPS as the SELECT user loads remained
constant at the 5, 10 and 20 SELECT user level and 20 SELECT
users with no partitioning. In Figure 18 we see that for insert
processing the TPS for the 20 user non-partitioned table was
slightly better than for that of the 20 user partitioned table.

Figure 18:
Combined Insert TPS Results
Figure 19 shows the affects of the varying
SELECT user loads on INSERT process response times. Again in
Figure 20 we see that for the INSERT processing the response
times for the 20 user non-partitioned SELECT user load we see
slightly better response times.

Figure 19:
Combined Insert Response Results
Combined Results Summary
Again, these results show that locking, as
expected, has little affect on SELECT processing since with
Oracle's single row (fine grained) locking model and multi-block
concurrency model readers will not be blocked by writers and
writers will not be blocked by readers.
It also shows that using the REFRESH ON
COMMIT materialized views should not adversely affect INSERT or
SELECT processing. Also the tests seem to indicate that for
SELECT processing using partitions is beneficial but for INSERT
processing, at least at the single row per transaction level,
the partitions may have a slightly negative affect on TPS and
response time.
Conclusions & Recommendations
Based on the data in this report it is
recommended that partitioned materialized views using the
REFRESH ON COMMIT refresh mechanism should be used to reduce the
strain on the underlying OLTP based tables when the same
database instance is used in OLTP and reporting.
While using partitioned materialized views
shows a slight increase in response times on INSERTS, the
benefits of their use outweigh the potential down sides.
-
When using Materialized View's to
denormalize tables (pre-joining tables), partitioning can
greatly reduce locking and improve refresh rates, but it
depends on the volatility of the tables being joined.
-
Partitioning Materialized View's works
best when the partition key corresponds to the most
highly-volatile table, such that a Materialized View refresh
will only touch (and lock) the most active partition.
|
|


