 |
|
Oracle log_buffer sizing tips
Donald K. Burleson
Updated April 3, 2015 |
Overview of redo log
tuning
Important note for
Oracle 10gr2 and
beyond: Per MOSC note 351857.1, starting in
release 10.2 and beyond, Oracle will automatically size the
log_buffer on your behalf and log_buffer cannot be changed
dynamically.
According to MOSC note 351857.1 “The Log_buffer
Cannot be Changed In 10g R2”, they changed the way how log buffer is
allocated. Oracle 10g R2. It combines fixed SGA and redo log
buffer. Free space that is left after fixed sized SGA is allocated in
the memory granule, Oracle dedicates to LOG_BUFFER. This is why on all
our systems log_buffer is around 14MB (our granule is 16MB, according
to _ksmg_granule_size parameter, and fixed size SGA is around 2MB).
The automatic log_buffer sizing is based
on the granule size (as determined by to _ksmg_granule_size):
select
   a.ksppinm name,

		  b.ksppstvl value,
   a.ksppdesc description
from

		  x$ksppi a,
   x$ksppcv b
where

		  a.indx = b.indx
and
   a.ksppinm =
		  '_ksmg_granule_size';

NAME
		  VALUE                DESCRIPTION

		  ------------------------------ --------------------
		  --------------------
_ksmg_granule_size
		  16777216             granule size in bytes
Also note that if you are
Oracle's Automatic Memory Management AMM (AMM is
Not recommended
for some databases), the log_buffer is part of the memory_target
algorithm.
Tuning the redo log in Oracle
The steps for tuning redo log
performance are straightforward:
1 -
Determine the
optimal sizing of the log_buffer.
2 - Size online redo logs
to control
the frequency of
log switches and minimize system waits.
3 - Optimize the redo log disk to prevent bottlenecks. In
high-update databases, no amount of disk tuning may relieve redo
log bottlenecks, because Oracle must push all updates, for all
disks, into a single redo location.
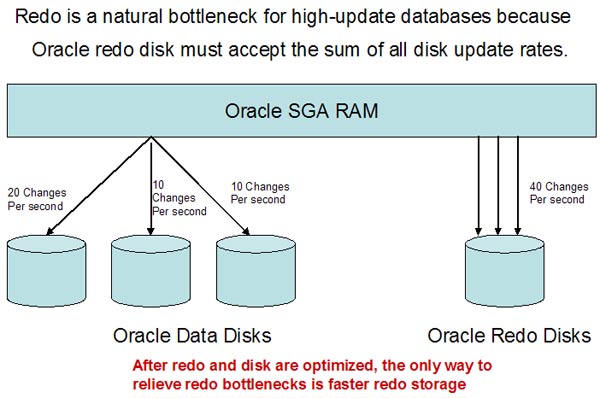
Once you have optimized your redo
and I/O sub-system, you have few options to relieve redo-induced
contention. This can be overcome by employing
super-fast
solid-state disk for your online
redo log files, since SSD has far greater bandwidth than platter
disk. For complete details on Oracle redo tuning and redo
diagnostic scripts, see my book "Oracle
Tuning: The Definitive Reference".
Optimizing the
log_buffer region
The log_buffer is one of the most complex of the Oracle RAM
region parameters to optimize, but it's a low-resource parameter (only using
a few meg of RAM), so the goal in sizing log_buffer is to set a value
that results in the least overall amount of log-related wait events.
The big issue
with the log buffer is determining the optimal sizing for the
log_buffer in a busy, high-DML database.
Common wait events related to a
too-small log_buffer size include high "redo log space requests"
and a too-large log_buffer may result in high "log file sync" waits.
For more details on log_buffer
sizing, see Bug 4930608 and MOSC Note 604351.1.
Per MOSC MOSC note 216205.1 Database Initialization
Parameters for Oracle Applications 11i, recommends a
log_buffer size
of 10 megabytes for Oracle Applications, a typical online database:
A value of 10MB for the log buffer is a reasonable value for
Oracle Applications and it represents a balance between
concurrent programs and online users.
The value of log_buffer
must be a multiple of redo block size, normally 512 bytes.
Obsolete advise
- Use a small log_buffer
Even though Oracle
has traditionally suggested a log_buffer no greater than one meg, I have seen
numerous shops where increasing log_buffer beyond one meg greatly
improved throughput and relieved undo contention.
The log_buffer should remain small.
This is perpetuated with
MOSC notes that have become somewhat
obsolete:
"In
a busy system, a value 65536 or higher is reasonable [for
log_buffer].
"It
has been noted previously that values larger than 5M may not
make a difference."
MOSC notes
that in 10gr2, we see a bug in log_buffer where a customer cannot
reduce the log_buffer size from 16 meg:
"In
10G R2, Oracle combines fixed SGA area and redo buffer [log
buffer] together. If there is a free space after Oracle puts the
combined buffers into a granule, that space is added to the redo
buffer. Thus you see redo buffer has more space as expected.
This is an expected behavior.. .
In
10.2 the log buffer is rounded up to use the rest of the
granule. The granule size can be found from the hidden parameter
"_ksmg_granule_size" and in your case is probably 16Mb. The
calculation for the granule size is a little convoluted but it
depends on the number of datafiles"
If the
log_buffer has been set too high (e.g. greater than 20 meg), causing
performance problems because the writes will be performed synchronously
because of the large log buffer size, evidenced by high log file sync
wait. Oracle consultant
Steve Adams notes details on how Oracle processes log file sync
waits:
"Before writing a batch of database blocks, DBWn finds the
highest high redo block address that needs to be synced before
the batch can be written.
DBWn then takes the redo allocation latch to ensure that the
required redo block address has already been written by LGWR,
and if not, it posts LGWR and sleeps on a log file sync wait."
Detecting
an undersized log_buffer
Here is a AWR report
showing a database with an undersized log_buffer, in this case
where the DBA did not set the log_buffer parameter in their
init.ora file:
Avg
Total Wait
wait Waits
Event Waits Timeouts Time (s)
(ms) /txn
---------------------------- ------------ ---------- ----------
------ --------
log
file sequential read 4,275 0 229
54 0.0
log
buffer space 12 0 3 235
0.0
Top 5 Timed Events
~~~~~~~~~~~~~~~~~~
% Total
Event Waits Time
(s) Ela Time
-------------------------------------------- ------------
----------- --------
CPU time
163,182 88.23
db file sequential read 1,541,854
8,551 4.62
log file
sync 1,824,469 8,402
4.54
log file parallel
write 1,810,628 2,413 1.30
SQL*Net more data to client 15,421,202
687 .37
It's important to note that log buffer shortages do not always
manifest in the top-5 timed events, especially if their are other
SGA pool shortages. Here is an example of an Oracle 10g
database with an undersized log buffer, in this example 512k (This
is the database as I found it, and there was a serious data
buffer shortage causing excessive disk I/O):
Top 5 Timed Events
~~~~~~~~~~~~~~~~~~ %
Total
Event Waits Time (s) DB
Time Wait Class
------------------------------ ------------ -----------
--------- -----------
log file parallel write 9,670 291
55.67 System I/O
log file sync 9,293 278
53.12 Commit
CPU time 225
43.12
db file parallel write 4,922 201
38.53 System I/O
control file parallel write 1,282 65
12.42 System I/O
Log
buffer related parameter issues
In addition to
re-sizing log_buffer, you can also adjust the hidden
Oracle10g parameter
_log_io_size (but only at the direction of Oracle technical
support) and adjust your transactions_per_rollback_segment
parameters. In 10g, the _log_io_size parameter
govern the offload threshold and it defaults to log_buffer/3.
The transactions_per_rollback_segment
parameter specifies the number of concurrent transactions you expect
each rollback segment to have to handle. The
Oracle 10g documentation notes:
"TRANSACTIONS_PER_ROLLBACK_SEGMENT specifies the number of
concurrent transactions you expect each rollback segment to have
to handle. The minimum number of rollback segments acquired at
startup is TRANSACTIONS divided by the value for this parameter.
For example, if TRANSACTIONS is 101 and this parameter is 10,
then the minimum number of rollback segments acquired would be
the ratio 101/10, rounded up to 11."
At startup
time, Oracle divides transactions by
transactions_per_rollback_segment to have enough rollback space,
and Oracle guru
Osamu Kobayashi has a great test of
transactions_per_rollback_segment:
"I set
transactions_per_rollback_segment to 4. The result of 2-4. in
fact suggests that twenty-one transactions are specified.
Twenty-one transactions also match the number of
transactions_per_rollback_segment that can be specified at the
maximum.
As far as I analyze, one rollback segment can handle up to
twenty-one transactions at a time, regardless of
transactions_per_rollback_segment value.
This transactions_per_rollback_segment parameter therefore is
used to determine the number of public rollback segments to
start."
CPU's,
log_buffer sizing and multiple log writer processes
The number of CPUs is
also indirectly related to the value of log_buffer, and
MOSC discusses multiple LGWR slaves that are used to asynchronously offload the redo information.
The hidden parameter _lgwr_io_slaves appear to govern the
appearance of multiple log writer slaves, and the
MOSC note that clearly states that multiple LGWR processes will
only appear under high activity. The Oracle docs are very clear on
this:
"Prior to Oracle8i you could configure multiple log writers
using the LGWR_IO_SLAVES parameter."
In Oracle10g it becomes a hidden parameter (_lgwr_io_slaves).
MOSC
note 109582.1 says that log I/O factotum processes started
way-back in Oracle8 and that they will only appear as DML activity
increases:
"Starting with Oracle8, I/O slaves are provided. These slaves
can perform asynchronous I/O even if the underlying OS does not
support Asynchronous I/O. These slaves can be deployed by DBWR,
LGWR, ARCH and the process doing Backup. . .
In Oracle8i, the DBWR_IO_SLAVES parameter determines the number
of IO slaves for LGWR and ARCH. . .
As there may not be substantial log writing taking place, only
one LGWR IO slave has been started initially. This may change
when the activity increases."
The
Oracle8 docs note that the value for the parameter
log_simultaneous_copies is dependent on the number of CPU's on
the server:
"On multiple-CPU computers, multiple redo copy latches allow
multiple processes to copy entries to the redo log buffer
concurrently. The default value of LOG_SIMULTANEOUS_COPIES is
the number of CPUs available to your Oracle instance"
Starting in
Oracle8i, it's a hidden parameter (_log_simultaneous_copies).
From
MOSC note
147471.1 "Tuning the Redo log Buffer Cache and Resolving
Redo Latch Contention",
we see that the default is set to cpu_count * 2.
Also, it
notes that
multiple
redo allocation latches become possible by setting the parm _log_parallelism,
and that the log buffer is split in multiple log_parallelism
areas that each have a size equal to the log_buffer.
Further, MOSC discusses the relationship of log_buffer to
the number of CPU's:
"The number of redo allocation latches is determined by init.ora
LOG_PARALLELISM. The redo allocation latch allocates space in
the log buffer cache for each transaction entry.
If
transactions are small, or if there is only one CPU on the
server, then the redo allocation latch also copies the
transaction data into the log buffer cache."
We also see
that log file parallel writes are related to the number of CPU's.
MOSC
note 34583.1 "WAITEVENT: "log file parallel write"
Reference Note", shows that the log_buffer size is
related to parallel writes (i.e. the number of CPU's), and discusses
how LGWR must wait until all parallel writes are complete. It notes
that solutions to high "log file parallel write" waits are directly
related to I/O speed, recommending that redo log members be on
high-speed disk, and that redo logs be segregated onto
"on
disks with little/no IO activity from other sources.
(including low activity from other sources against the same disk
controller)".
This is a
strong argument for using super-fast solid-state disk.
Here are some great
tips by Steve Adams for sizing your log_buffer:
"If the log buffer is too small, then
log buffer space
waits will be seen during bursts of redo generation. LGWR may not
begin to write redo until the _log_io_size threshold
(by default, 1/3
of the log buffer or 1M whichever is less) has been exceeded, and
the remainder of the log buffer may be filled before LGWR can
complete its writes and free some space in the log buffer.
Ideally, the log buffer should be large enough to cope with
all bursts of redo generation, without any
log buffer space
waits.
Commonly, the most severe bursts of redo generation occur
immediately after a log switch, when redo generation has been
disabled for some time, and there is a backlog of demand for log
buffer space"
Also see:
|


