| |
 |
|
Oracle Streams Benchmark Testing
Oracle Database Tips by Donald Burleson |
Benchmarking Oracle Streams
Oracle Streams is a popular free alternative to
Oracle RAC for failover and disaster recovery, but it is important
to note that Oracle Streams is not a panacea, and it's not
appropriate for all databases. Oracle Streams has no licensing
costs (RAC costs extra) and it is less complex to configure than a
RAC database. This disadvantage over RAC is that there is no
continuous availability, update collisions may occur, replication is
not instant, and application failover is usually done manually.
The "Oracle
Streams" book has a complete step-by-step troubleshooting guide
for fixing problems in Streams propagation.
When using Oracle Streams for n-way replication
it is critical to implode each instance with DML to determine the
point where Oracle will experience contention.
The paper below describes a DML stress test on
Oracle 10g Streams, using the Quest Benchmark factory software
We also need to understand the limits of
cross-replicating Oracle systems with Oracle Streams. For more
information on Streams vs. RAC for failover, see my notes here:
Oracle Streams Stress test Executive Summary
The purpose of this DML stress test was to
implode an Oracle instance with insert transactions and observe the
breaking-point as high-volumes of data replicate to the to a remote
server using n-way Oracle Streams.
This Oracle Streams stress test was a
tremendous success and shows these exact areas where the database
will experience contentions at high loads. The test also revealed
maximum rates (per server) for I/O, including disk reads, disk
writes and maximum updates per second.
- 400
writes per second
-
7,000 disk reads per second
-
12,000 updates per second
-
19,000 logical buffer reads per second
- UGA
memory access at 18 million per second
We now know the
areas where we will have future problems as system update activity
increases:
- We
need to monitor the log switch interval and re-size the online
redo logs if switches occur more frequently than every 15
minutes.
- We
need to monitor Streams spills to disk and increase the streams
pool to ensure that we never have disk enqueues.
- Hot
tables may eventually have to be moved from ASSM to standard,
multiple freelists.
Oracle Streams Stress Test Overview
The subject of this test is an Oracle server
that is using Oracle10g 2-way Streams replication across a 90-mile
high-speed interconnect. Figure 1 shows a model of the Oracle
server architecture:
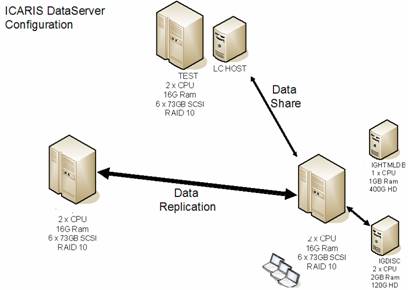
Figure 1 - The Oracle server architecture
This test imploded the Oracle instance with
insert statements in order to locate the system bottleneck, focusing
on the ability of Oracle to replicate the data across the Oracle
Streams interface to the remote server. The default block size is
8k with a special 32k tablespace for the indexes.
This test used the Quest Benchmark Factory to
generate the insert statements, not using bind variables.
Predictions
As DML transactions increase we would expect
the stress to increase on those instance components associated with
DML:
-
Redo log contention - We expect to see very-frequent log
switches and waits on redo
-
Streams replication enqueues - We expect to see the Oracle
Streams back-up and enqueue (to disk).
-
Object contention - As inert rates increase we expect to
note segment contention on the bitmap freelists (this test has
tablespaces with ASSM).
-
RAM exhaustion - We expect to see contention within the
shared_pool and db_cache_size.
Streams Stress Experiment Results
This test was a tremendous success and shows
these exact areas where the database will experience contentions at
high loads and also reveals maximum rates for I/O, including disk
reads, disk writes and maximum updates per second.
The AWR report from the stress test is in
Appendix A. We noted excellent rates for data block access:
- 400 writes per second
- 7,000 disk reads per second
- 12,000 updates per second
- 19,000 logical buffer reads per second
- UGA memory access at 18 million per second
Instance
Activity Stats DB/Inst: CATGT/catgt Snaps:
911-912
Statistic Total per
Second per Trans
-------------------------------- ------------------
-------------- -------------
db block
changes 1,888,093
11,989.6 26.0
db block
gets 2,697,885
17,131.8 37.2
physical read
bytes 1,122,304 7,126.7
15.5
physical read
total IO requests 3,451 21.9
0.1
physical read
total bytes 610,102,272 3,874,206.4
8,410.8
physical
write IO requests 57,900
367.7 0.8
physical
write bytes 528,932,864 3,358,773.1
7,291.8
physical
write total IO requests 73,400
466.1 1.0
physical
write total bytes 1,864,753,152 11,841,356.6
25,707.3
session uga
memory 12,884,963,888 81,820,723.5
177,630.5
During the heavy load on the system, we
observed that the redo and Steams became system bottlenecks:
Top 5 Timed
Events Avg %Total
~~~~~~~~~~~~~~~~~~ wait
Call
Event Waits Time (s) (ms)
Time Wait Class
------------------------------ ------------ ----------- ------
------ ----------
log file
sync 73,876 1,977 27 44.3
Commit
enq: HW -
contention 554 874 1578 19.6
Configurat
enq: SQ -
contention 3,169 680 215 15.3
Configurat
CPU
time 235
5.3
latch:
library cache 8,022 172 21 3.9
Concurrenc
-------------------------------------------------------------
Redo Log contention
For this load level the size of the redo logs
is insufficient, at the very start we were doing 197 switches per
hour at the end 205.
Statistic Total per Hour
-------------------------------- ------------------ ---------
log
switches (derived) 9 205.74
For recoverability we want to keep the redo
size at the default value (512k) so that we can get a few log
switches per day. If we make them too large we risk loosing
multiple days work.
Object Contention
Our biggest stress point for blocks appears to
be row lock waits on the indexes. This was probably because we were
doing a high volume of updates along with the inserts, in normal
operation we probably won't see this mix at this stress level. We
used ASSM and noted issues with the initrans value. We may want to
switch to manual for some tables if we expect this level of stress.
At max stress we were also seeing sequence and
object high watermark enqueues. The sequence enqueues probably
indicate we need to increase the caching level for the sequences
(I'll wager they are at the default of 20, we may wish to bump that
up to 100 or so). The HWM enqueues are because we started expanding
the table quickly...we may want to look at the tablespace settings
for extent size.
Enqueue Type
(Request Reason)
------------------------------------------------------------------------------
Requests Succ Gets Failed Gets Waits Wt Time (s) Av Wt
Time(ms)
------------
------------ ----------- ----------- ------------ --------------
SQ-Sequence
Cache
6,671 6,660 0 3,050 631
207.00
TX-Transaction (index contention)
1,589 1,588 0 1,565
8 5.35
We also note that the bitmap freelists (as
implemented via Automatic Segment Storage Management - ASSM) become
overloaded, resulting in buffer busy waits:
Buffer
Tablespace Subobject Obj. Busy
% of
Owner
Name Object Name Name Type Waits
Capture
---------- ---------- -------------------- ---------- -----
------------ -------
CAT_SCHEMA
CAT_SCHEMA XPKIM_DONALDS
INDEX 2,768 73.85
Streams Contention
As predicted, we noted enqueue contention
within Oracle Streams as transactions backed-up to be replicated to
the remote server:
Avg
%Time Total
Wait wait Waits
Event Waits -outs Time (s)
(ms) /txn
---------------------------- -------------- ------ -----------
------- ---------
enq: HW -
contention 554 47.8 874
1578 0.0
Streams
capture: waiting for 85 50.6 112
1321 0.0
Streams AQ:
waiting for mess 91 96.7 330 3627
0.0
virtual
circuit status 6 100.0 176
29294 0.0
Streams AQ:
waiting for time 7 42.9 166 23752
0.0
Streams AQ:
qmn coordinator 78 37.2 161 2067
0.0
At this level of activity streams is spilling,
this is causing it to not keep up as well as it should (spilling
means going to disk) we need a larger streams pool. At maximum
(according to the report) we will need about a 400 megabyte streams
pool. We may also want to look at multiple streams processes.
Streams Pool
Advisory DB/Inst: CATGT/catgt Snap:
912
Size
for Size Est Spill Est Spill Est Unspill Est Unspill
Est (MB)
Factor Count Time (s) Count Time (s)
----------
--------- ----------- ----------- ----------- -----------
48
0.2 2,133,680 658 394,800 108
80 0.4 1,215,434 382 169,076 46
112 0.5 581,667 192 49,401 13
144 0.7 146,351 45 26,205 7
176 0.8 50,491 15 15,787 4
208 1.0
27,981 8 10,845 3
240 1.2 14,558 4 7,167 2
272 1.3 5,839 1 3,506 1
304 1.5 1,390 0 1,260 0
336 1.6 126 0 701 0
-------------------------------------------------------------
We also see high CPU activity associated with
Streams during the high update period
Streams
CPU/IO Usage DB/Inst: CATGT/catgt Snaps:
911-912
-> Streams
processes ordered by CPU usage
-> CPU and
I/O Time in micro seconds
Session
Type CPU Time User I/O Time Sys I/O Time
------------------------- -------------- --------------
--------------
STREAMS Apply
Reader 6,099,450 20,501 13,413
Logminer
Reader 970,096 0 8,876,876
Lessons Learned
-
Streams pool size and multiple streams processes (see Mike for
advice)
-
Increase sequence caching to 100
-
Review extent sizes for the most active tables (fbi_donald,
fbi_establishment)
We now know what
will happen as the load expands and we can prepare for future
high-stress conditions:
- We
need to monitor the log switch interval and re-size the online
redo logs if switches occur more frequently than every 15
minutes.
- We
need to monitor Streams spills to disk and increase the streams
pool to ensure that we never have disk enqueues.
- Hot
tables (fbi_donald) may eventually have to be moved from ASSM to
standard, multiple freelists.
Appendix A - AWR Report
WORKLOAD
REPOSITORY report for
DB Name
DB Id Instance Inst Num Release RAC Host
------------
----------- ------------ -------- ----------- --- ------------
CATGT
2438152563 catgt 1 10.2.0.1.0 NO catgmis-gt.g
Snap Id Snap Time Sessions Curs/Sess
--------- ------------------- -------- ---------
Begin
Snap: 911 16-Mar-06 22:30:32 81 7.7
End Snap: 912
16-Mar-06 22:33:10 80 7.7
Elapsed: 2.62 (mins)
DB Time: 74.32 (mins)
Cache Sizes
~~~~~~~~~~~ Begin End
---------- ----------
Buffer Cache: 3,376M 3,376M Std Block Size: 8K
Shared Pool Size: 624M 624M Log Buffer:
14,400K
Load Profile
~~~~~~~~~~~~ Per Second Per
Transaction
---------------
---------------
Redo size: 2,292,249.69
4,976.41
Logical reads: 19,080.45 41.42
Block changes:
11,989.57 26.03
Physical reads: 0.70 0.00
Physical writes:
409.84 0.89
User calls:
1,252.97 2.72
Parses:
739.47 1.61
Hard parses: 5.81 0.01
Sorts:
2.37 0.01
Logons:
0.04 0.00
Executes:
943.47 2.05
Transactions: 460.62
% Blocks
changed per Read: 62.84 Recursive Call %: 64.98
Rollback per
transaction %: 0.03 Rows per Sort: 36.06
Instance
Efficiency Percentages (Target 100%)
~~~~~~~~~~~~~~~~~~~~~~~~~~~~~~~~~~~~~~~~~~~~~
Buffer Nowait %: 99.86 Redo NoWait %: 99.96
Buffer Hit %: 100.00 In-memory Sort %: 100.00
Library Hit %: 99.80 Soft Parse %: 99.21
Execute to Parse %: 21.62 Latch Hit %: 99.83
Parse CPU to
Parse Elapsd %: 21.32 % Non-Parse CPU: 91.63
Shared Pool
Statistics Begin End
------ ------
Memory Usage %: 72.94 81.20
% SQL with
executions>1: 97.06 82.84
% Memory for
SQL w/exec>1: 94.55 79.61
Top 5 Timed
Events Avg %Total
~~~~~~~~~~~~~~~~~~ wait
Call
Event Waits Time (s) (ms)
Time Wait Class
------------------------------ ------------ ----------- ------
------ ----------
log file sync 73,876 1,977 27
44.3 Commit
enq: HW - contention 554 874 1578
19.6 Configurat
enq: SQ - contention 3,169 680 215
15.3 Configurat
CPU time
235 5.3
latch: library cache 8,022 172
21 3.9 Concurrenc
-------------------------------------------------------------
Time Model
Statistics DB/Inst: CATGT/catgt Snaps:
911-912
-> Total time
in database user-calls (DB Time): 4459.1s
-> Statistics
including the word "background" measure background process
time, and so
do not contribute to the DB time statistic
-> Ordered by %
or DB time desc, Statistic name
Statistic
Name Time (s) % of DB Time
------------------------------------------ ------------------
------------
sql execute elapsed time
2,152.0 48.3
sequence load elapsed time
748.3 16.8
DB
CPU
234.6 5.3
PL/SQL
execution elapsed time 177.9
4.0
parse time
elapsed 91.7 2.1
hard parse
elapsed time 7.1 .2
repeated bind
elapsed time 0.1 .0
PL/SQL
compilation elapsed time 0.1
.0
failed parse
elapsed time 0.0 .0
hard parse
(sharing criteria) elapsed time 0.0 .0
connection
management call elapsed time 0.0 .0
hard parse
(bind mismatch) elapsed time 0.0 .0
DB
time
4,459.1 N/A
background
elapsed time 235.9 N/A
background cpu
time 11.3 N/A
-------------------------------------------------------------
Wait
Class DB/Inst: CATGT/catgt
Snaps: 911-912
-> s - second
-> cs -
centisecond - 100th of a second
-> ms -
millisecond - 1000th of a second
-> us -
microsecond - 1000000th of a second
-> ordered by
wait time desc, waits desc
Avg
%Time Total Wait
wait Waits
Wait
Class Waits -outs Time (s)
(ms) /txn
-------------------- ---------------- ------ ----------------
------- ---------
Commit 73,876 .1
1,977 27 1.0
Configuration 4,220 11.9
1,773 420 0.1
Concurrency 16,589 .8
370 22 0.2
Network 117,711 .0
147 1 1.6
System
I/O 14,444 .0 124
9 0.2
Other 5,945 2.5
77 13 0.1
Application 2,478 .0
4 1 0.0
User I/O
567 .0 1 2
0.0
-------------------------------------------------------------
Wait
Events DB/Inst: CATGT/catgt Snaps:
911-912
-> s - second
-> cs -
centisecond - 100th of a second
-> ms -
millisecond - 1000th of a second
-> us -
microsecond - 1000000th of a second
-> ordered by
wait time desc, waits desc (idle events last)
Avg
%Time Total Wait wait
Waits
Event Waits -outs Time (s)
(ms) /txn
---------------------------- -------------- ------ -----------
------- ---------
log file
sync 73,876 .1 1,977
27 1.0
enq: HW - contention 554 47.8
874 1578 0.0
enq: SQ -
contention 3,169 3.7 680
215 0.0
latch: library
cache 8,022 .0 172 21
0.1
buffer busy
waits 4,316 2.9 169 39
0.1
SQL*Net more
data to dblink 18,425 .0 146 8
0.3
Streams capture: waiting for 85 50.6
112 1321 0.0
log file
parallel write 10,451 .0 99
9 0.1
log file switch
(checkpoint 181 39.2 97 535 0.0
rdbms ipc
reply 339 5.9 48
143 0.0
control file
parallel write 359 .0 13 35
0.0
latch
free 1,463 .0 10
7 0.0
log file
sequential read 521 .0 10
19 0.0
latch: enqueue
hash chains 1,312 .0 9 7
0.0
latch: library
cache pin 958 .0 8 9
0.0
log file switch
completion 187 2.7 8 43 0.0
enq: TX - index
contention 1,776 .0 8 4 0.0
latch: cache
buffers chains 1,214 .0 7 6
0.0
buffer
deadlock 104 100.0 5
46 0.0
latch: shared
pool 207 .0 4 21
0.0
SQL*Net
break/reset to clien 2,478 .0 4
1 0.0
Log archive
I/O 431 .0 2 6
0.0
LGWR wait for
redo copy 2,078 1.3 2 1
0.0
latch: session
allocation 264 .0 1 6
0.0
Data file init
write 257 .0 1 4
0.0
latch: redo
copy 38 .0 1 28
0.0
latch: library
cache lock 71 .0 1 11
0.0
SQL*Net message
to client 99,091 .0 1 0 1.4
latch: cache
buffers lru cha 66 .0 1 9
0.0
enq: US -
contention 58 .0 0
8 0.0
row cache
lock 5 .0 0
83 0.0
os thread
startup 3 .0 0
109 0.0
latch: redo
allocation 166 .0 0 2
0.0
enq: CF -
contention 7 .0 0
36 0.0
latch: object
queue header o 36 .0 0 6
0.0
cursor: mutex
S 9 .0 0 20
0.0
db file single
write 31 .0 0 6
0.0
db file
sequential read 75 .0 0
1 0.0
latch: undo
global data 43 .0 0 2
0.0
control file
sequential read 2,646 .0 0 0
0.0
latch: row
cache objects 8 .0 0
5 0.0
SQL*Net more
data to client 109 .0 0 0
0.0
wait list latch
free 2 .0 0 11 0.0
log file single
write 36 .0 0 1 0.0
enq: TX -
contention 2 .0 0
7 0.0
undo segment
extension 1 100.0 0 13
0.0
enq: TX -
allocate ITL entry 2 .0 0
6 0.0
enq: FB -
contention 5 .0 0
2 0.0
latch: redo
writing 3 .0 0 0
0.0
direct path
read 99 .0 0 0
0.0
direct path
write 103 .0 0 0
0.0
SQL*Net message
to dblink 72 .0 0 0 0.0
db file
scattered read 2 .0 0
0 0.0
SQL*Net more
data from clien 14 .0 0 0
0.0
SQL*Net message
from client 99,093 .0 4,468 45 1.4
Streams AQ: waiting for mess 91 96.7
330 3627 0.0
virtual circuit status 6 100.0 176
29294 0.0
Streams AQ: waiting for time 7 42.9 166
23752 0.0
Streams AQ: qmn coordinator 78 37.2
161 2067 0.0
LogMiner:
wakeup event for p 877 20.0 161
183 0.0
Wait
Events DB/Inst: CATGT/catgt Snaps:
911-912
-> s - second
-> cs -
centisecond - 100th of a second
-> ms -
millisecond - 1000th of a second
-> us -
microsecond - 1000000th of a second
-> ordered by
wait time desc, waits desc (idle events last)
Avg
%Time Total
Wait wait Waits
Event Waits -outs Time
(s) (ms) /txn
---------------------------- -------------- ------ -----------
------- ---------
Streams AQ: qmn
slave idle w 48 .0 159 3318 0.0
LogMiner:
wakeup event for b 22,391 .4 157
7 0.3
wait for unread
message on b 52,923 .2 157 3 0.7
Streams AQ:
delete acknowled 42 50.0 156 3725
0.0
LogMiner:
wakeup event for r 1,312 8.8 151
115 0.0
jobq slave
wait 47 100.0 138
2931 0.0
SQL*Net message
from dblink 72 .0 15 207 0.0
LogMiner:
client waiting for 1 .0 0
0 0.0
-------------------------------------------------------------
Background Wait
Events DB/Inst: CATGT/catgt Snaps: 911-912
-> ordered by
wait time desc, waits desc (idle events last)
Avg
%Time Total
Wait wait Waits
Event Waits -outs Time
(s) (ms) /txn
---------------------------- -------------- ------ -----------
------- ---------
log file parallel write 10,451 .0
99 9 0.1
control file
parallel write 266 .0 11 43
0.0
enq: HW -
contention 3 66.7 6
1954 0.0
log file switch
(checkpoint 6 33.3 4 628 0.0
Log archive
I/O 431 .0 2 6
0.0
events in
waitclass Other 2,221 1.2 2
1 0.0
log file
sync 21 .0 2 85
0.0
buffer busy
waits 2 50.0 1 701
0.0
log file
sequential read 460 .0 1
2 0.0
os thread
startup 3 .0 0
109 0.0
latch: library
cache 3 .0 0 19
0.0
latch: shared
pool 6 .0 0 6
0.0
control file
sequential read 1,256 .0 0 0
0.0
log file single
write 36 .0 0 1 0.0
latch: cache
buffers chains 1 .0 0 10
0.0
Data file init
write 9 .0 0 1
0.0
latch: library
cache pin 1 .0 0 4
0.0
latch: redo
writing 3 .0 0 0
0.0
direct path
read 99 .0 0 0
0.0
direct path
write 99 .0 0 0
0.0
rdbms ipc
message 2,162 21.4 3,160
1462 0.0
Streams AQ:
waiting for time 7 42.9 166 23752
0.0
pmon
timer 67 86.6 161
2408 0.0
Streams AQ: qmn
coordinator 78 37.2 161 2067 0.0
Streams AQ: qmn
slave idle w 48 .0 159 3318 0.0
Streams AQ:
delete acknowled 42 50.0 156 3725
0.0
-------------------------------------------------------------
Operating
System Statistics DB/Inst: CATGT/catgt Snaps:
911-912
Statistic Total
-------------------------------- --------------------
BUSY_TIME 15,717
IDLE_TIME 7,884
NICE_TIME 4
SYS_TIME 2,872
USER_TIME 12,841
LOAD 7
RSRC_MGR_CPU_WAIT_TIME 0
PHYSICAL_MEMORY_BYTES 21,408
NUM_CPUS 2
-------------------------------------------------------------
Service
Statistics DB/Inst: CATGT/catgt Snaps:
911-912
-> ordered by
DB Time
Physical Logical
Service
Name DB Time (s) DB CPU (s)
Reads Reads
-------------------------------- ------------ ------------
---------- ----------
catgt.gov.com 3,983.9
204.4 0 2,890,235
SYS$USERS 217.7
29.0 12 106,336
SYS$BACKGROUND 0.0
0.0 99 631
catgtXDB 0.0
0.0 0 0
-------------------------------------------------------------
Service Wait
Class Stats DB/Inst: CATGT/catgt Snaps:
911-912
-> Wait Class
info for services in the Service Statistics section.
-> Total Waits
and Time Waited displayed for the following wait
classes:
User I/O, Concurrency, Administrative, Network
-> Time Waited
(Wt Time) in centisecond (100th of a second)
Service Name
----------------------------------------------------------------
User I/O User
I/O Concurcy Concurcy Admin Admin Network Network
Total Wts Wt
Time Total Wts Wt Time Total Wts Wt Time Total Wts Wt Time
---------
--------- --------- --------- --------- --------- ---------
---------
catgt.gov.com
330
126 16395 35593 0 0 98851 66
SYS$USERS
30 12 178 1209 0 0
18858 14594
SYS$BACKGROUND
207 1 16 184 0 0
0 0
-------------------------------------------------------------
Instance
Activity Stats DB/Inst: CATGT/catgt Snaps:
911-912
Statistic Total per
Second per Trans
-------------------------------- ------------------
-------------- -------------
CPU used by
this session 12,458 79.1
0.2
CPU used when
call started 9,730 61.8
0.1
CR blocks
created 232
1.5 0.0
Cached Commit
SCN referenced 322 2.0
0.0
Commit SCN
cached 1
0.0 0.0
DB
time 486,035
3,086.4 6.7
DBWR checkpoint
buffers written 64,431 409.1 0.9
DBWR
checkpoints 9
0.1 0.0
DBWR object
drop buffers written 0 0.0
0.0
DBWR revisited
being-written buf 2 0.0
0.0
DBWR tablespace
checkpoint buffe 0 0.0 0.0
DBWR thread
checkpoint buffers w 64,431 409.1
0.9
DBWR
transaction table writes 145
0.9 0.0
DBWR undo block
writes 21,233 134.8 0.3
Misses for
writing mapping 0
0.0 0.0
PX local
messages recv'd 0
0.0 0.0
PX local
messages sent 0
0.0 0.0
SMON posted for
undo segment shr 0 0.0 0.0
SQL*Net
roundtrips to/from clien 98,961
628.4 1.4
SQL*Net
roundtrips to/from dblin 72
0.5 0.0
active txn
count during cleanout 13,029
82.7 0.2
application
wait time 364 2.3
0.0
auto extends on
undo tablespace 31 0.2 0.0
background
checkpoints completed 9
0.1 0.0
background
checkpoints started 9
0.1 0.0
background
timeouts 505
3.2 0.0
branch node
splits 18 0.1
0.0
buffer is not
pinned count 57,651 366.1
0.8
buffer is
pinned count 22,747
144.5 0.3
bytes received
via SQL*Net from 112,370,818 713,565.2
1,549.1
bytes received
via SQL*Net from 3,312 21.0
0.1
bytes sent via
SQL*Net to client 11,336,953 71,990.7
156.3
bytes sent via
SQL*Net to dblink 36,804,590 233,712.6
507.4
calls to get
snapshot scn: kcmgs 352,178 2,236.4
4.9
calls to
kcmgas 106,984
679.4 1.5
calls to
kcmgcs 2,299
14.6 0.0
change write
time 1,436 9.1
0.0
cleanout -
number of ktugct call 15,569 98.9
0.2
cleanouts and
rollbacks - consis 1 0.0
0.0
cleanouts only
- consistent read 28 0.2
0.0
cluster key
scan block gets 269 1.7
0.0
cluster key
scans 144 0.9
0.0
commit batch
performed 0 0.0
0.0
commit batch
requested 0 0.0
0.0
commit
batch/immediate performed 382
2.4 0.0
commit
batch/immediate requested 382
2.4 0.0
commit cleanout
failures: block 0 0.0 0.0
commit cleanout
failures: buffer 3 0.0 0.0
commit cleanout
failures: callba 504 3.2 0.0
commit cleanout
failures: cannot 2,054 13.0 0.0
commit
cleanouts 812,841
5,161.6 11.2
commit
cleanouts successfully co 810,280
5,145.4 11.2
commit
immediate performed 382
2.4 0.0
commit
immediate requested 382
2.4 0.0
commit txn
count during cleanout 12,173
77.3 0.2
concurrency
wait time 36,976 234.8
0.5
consistent
changes 1,575 10.0
0.0
consistent
gets 306,865
1,948.6 4.2
consistent gets
- examination 110,375 700.9 1.5
consistent gets
direct 0 0.0 0.0
Instance
Activity Stats DB/Inst: CATGT/catgt Snaps:
911-912
Statistic Total per
Second per Trans
-------------------------------- ------------------
-------------- -------------
consistent gets
from cache 306,865 1,948.6 4.2
cursor
authentications 12
0.1 0.0
data blocks
consistent reads - u 1,488 9.5
0.0
db block changes 1,888,093
11,989.6 26.0
db block gets 2,697,885
17,131.8 37.2
db block gets
direct 10 0.1
0.0
db block gets from cache 2,697,875
17,131.8 37.2
deferred
(CURRENT) block cleanou 458,436
2,911.1 6.3
enqueue
conversions 4,322
27.5 0.1
enqueue releases 1,243,464
7,896.1 17.1
enqueue requests 1,243,422
7,895.9 17.1
enqueue
timeouts 4
0.0 0.0
enqueue
waits 5,016 31.9
0.1
exchange
deadlocks 105
0.7 0.0
execute
count 148,576
943.5 2.1
free buffer
inspected 4 0.0
0.0
free buffer
requested 33,519 212.9
0.5
global undo
segment hints helped 0 0.0
0.0
global undo
segment hints were s 0 0.0
0.0
heap block
compress 660
4.2 0.0
immediate (CR)
block cleanout ap 29 0.2
0.0
immediate
(CURRENT) block cleano 11,861
75.3 0.2
index fast full
scans (full) 2 0.0 0.0
index fetch by
key 31,043 197.1
0.4
index scans
kdiixs1 5,334 33.9
0.1
leaf node 90-10
splits 356 2.3 0.0
leaf node
splits 3,834
24.4 0.1
lob
reads 16
0.1 0.0
lob
writes 1,245
7.9 0.0
lob writes
unaligned 1,245
7.9 0.0
logons
cumulative 7
0.0 0.0
messages
received 10,934 69.4
0.2
messages
sent 10,934
69.4 0.2
no buffer to
keep pinned count 0 0.0
0.0
no work -
consistent read gets 109,489
695.3 1.5
opened cursors
cumulative 116,453 739.5
1.6
parse count
(failures) 3 0.0
0.0
parse count
(hard) 915 5.8
0.0
parse count
(total) 116,451 739.5
1.6
parse time
cpu 1,963
12.5 0.0
parse time
elapsed 9,208
58.5 0.1
physical read
IO requests 102 0.7
0.0
physical read bytes 1,122,304
7,126.7 15.5
physical read total IO requests 3,451
21.9 0.1
physical read total bytes 610,102,272
3,874,206.4 8,410.8
physical read
total multi block 546 3.5
0.0
physical
reads 110
0.7 0.0
physical reads
cache 11 0.1
0.0
physical reads
cache prefetch 8 0.1
0.0
physical reads
direct 99 0.6
0.0
physical reads
direct (lob) 0 0.0
0.0
physical reads
direct temporary 0 0.0
0.0
physical reads
prefetch warmup 8 0.1
0.0
physical write IO requests 57,900
367.7 0.8
physical write bytes 528,932,864
3,358,773.1 7,291.8
physical write total IO requests 73,400
466.1 1.0
physical write total bytes 1,864,753,152
11,841,356.6 25,707.3
physical write
total multi block 32,763 208.1
0.5
physical
writes 64,540
409.8 0.9
physical writes
direct 109 0.7 0.0
Instance
Activity Stats DB/Inst: CATGT/catgt Snaps:
911-912
Statistic Total per
Second per Trans
-------------------------------- ------------------
-------------- -------------
physical writes
direct (lob) 0 0.0 0.0
physical writes
direct temporary 0 0.0 0.0
physical writes
from cache 64,431 409.1 0.9
physical writes
non checkpoint 28,991 184.1 0.4
pinned buffers
inspected 0 0.0
0.0
prefetch warmup
blocks flushed o 4 0.0 0.0
process last
non-idle time 144 0.9
0.0
recovery blocks
read 0 0.0 0.0
recursive
calls 366,044
2,324.4 5.1
recursive cpu
usage 3,357 21.3
0.1
redo blocks
read for recovery 0 0.0
0.0
redo blocks
written 735,344 4,669.5
10.1
redo buffer
allocation retries 127 0.8
0.0
redo
entries 963,697
6,119.6 13.3
redo log space
requests 376 2.4
0.0
redo log space
wait time 10,752 68.3
0.2
redo ordering
marks 18,623 118.3
0.3
redo size 360,978,896
2,292,249.7 4,976.4
redo synch
time 201,297
1,278.3 2.8
redo synch
writes 158,963
1,009.4 2.2
redo
wastage 3,566,412
22,647.1 49.2
redo write
time 10,069
63.9 0.1
redo writer
latching time 186 1.2
0.0
redo
writes 10,431
66.2 0.1
rollback
changes - undo records 1,081
6.9 0.0
rollbacks only
- consistent read 227 1.4
0.0
rows fetched
via callback 3,355 21.3
0.1
session connect
time 0 0.0 0.0
session cursor
cache hits 114,859 729.4
1.6
session logical reads 3,004,751
19,080.5 41.4
session pga memory 28,908,720
183,573.1 398.5
session pga memory max 33,889,456
215,201.2 467.2
session uga memory 12,884,963,888
81,820,723.5 177,630.5
session uga
memory max 6,539,128 41,524.1
90.2
shared hash
latch upgrades - no 6,585 41.8
0.1
sorts
(memory) 374
2.4 0.0
sorts
(rows) 13,488
85.7 0.2
sql area
purged 0
0.0 0.0
switch current
to new buffer 1,208 7.7
0.0
table fetch by
rowid 37,468 237.9
0.5
table fetch
continued row 993 6.3
0.0
table scan
blocks gotten 79,609
505.5 1.1
table scan rows gotten 2,652,165
16,841.5 36.6
table scans
(direct read) 0 0.0
0.0
table scans
(long tables) 0 0.0
0.0
table scans
(rowid ranges) 0 0.0
0.0
table scans
(short tables) 629 4.0
0.0
total number of
times SMON poste 0 0.0 0.0
transaction
rollbacks 382 2.4
0.0
transaction
tables consistent re 0 0.0
0.0
transaction
tables consistent re 0 0.0
0.0
undo change vector size 125,933,028
799,686.5 1,736.1
user I/O wait
time 137 0.9
0.0
user calls 197,315
1,253.0 2.7
user commits
72,513 460.5
1.0
user
rollbacks 25
0.2 0.0
workarea
executions - onepass 0
0.0 0.0
workarea
executions - optimal 297
1.9 0.0
write clones
created in backgrou 12 0.1
0.0
write clones
created in foregrou 5,928 37.6
0.1
-------------------------------------------------------------
Instance
Activity Stats - Absolute ValuesDB/Inst: CATGT/catgt Snaps:
911-912
-> Statistics
with absolute values (should not be diffed)
Statistic Begin Value End Value
-------------------------------- --------------- ---------------
session cursor
cache count 286,588 286,704
opened cursors
current 624 614
logons
current 81 80
-------------------------------------------------------------
Instance
Activity Stats - Thread Activity DB/Inst: CATGT/catgt Snaps:
911-912
-> Statistics
identified by '(derived)' come from sources other than SYSSTAT
Statistic Total per Hour
-------------------------------- ------------------ ---------
log switches
(derived) 9 205.74
-------------------------------------------------------------
Tablespace IO
Stats DB/Inst: CATGT/catgt Snaps: 911-912
-> ordered by
IOs (Reads + Writes) desc
Tablespace
------------------------------
Av Av Av Av
Buffer Av Buf
Reads
Reads/s Rd(ms) Blks/Rd Writes Writes/s Waits Wt(ms)
-------------- ------- ------ ------- ------------ --------
---------- ------
CAT_SCHEMA
27 0 0.0 1.0 36,024 229
3,743 6.4
UNDOTBS1
9 0 0.0 1.0 16,205
103 549 237.1
SYSAUX
13 0 7.7 1.6 640
4 0 0.0
SYSTEM
9 0 0.0 1.0
57 0 2 720.0
USERS
18 0 0.0 1.0 18 0 0
0.0
FLOW_1
9 0 0.0 1.0 9 0 0 0.0
STREAMS_TBS
9 0 0.0 1.0 9 0 0 0.0
CAT_SCHEMA_32
9 0 0.0
1.0 9 0 0 0.0
-------------------------------------------------------------
File IO
Stats DB/Inst: CATGT/catgt Snaps:
911-912
-> ordered by
Tablespace, File
Tablespace Filename
------------------------
----------------------------------------------------
Av Av Av Av
Buffer Av Buf
Reads Reads/s Rd(ms) Blks/Rd
Writes Writes/s Waits Wt(ms)
--------------
------- ------ ------- ------------ -------- ---------- ------
FLOW_1
/u01/app/oracle/oradata/catgt/FLOW_1.dbf
9 0 0.0 1.0 9 0 0 0.0
STREAMS_TBS
/u02/app/oracle/oradata/catgt/streams_tbs.dbf
9 0 0.0 1.0 9 0 0 0.0
SYSAUX
/u01/app/oracle/oradata/catgt/sysaux01.dbf
13 0 7.7
1.6 640 4 0 0.0
SYSTEM
/u01/app/oracle/oradata/catgt/system01.dbf
9 0 0.0 1.0 57
0 2 720.0
CAT_SCHEMA
/u01/app/oracle/oradata/catgt/CAT_SCHEMA03.dbf
9 0 0.0 1.0 12,243 78
1,165 5.1
CAT_SCHEMA
/u02/app/oracle/oradata/catgt/CAT_SCHEMA01.dbf
9 0 0.0 1.0 11,766 75
1,565 6.8
CAT_SCHEMA
/u03/app/oracle/oradata/catgt/CAT_SCHEMA02.dbf
9 0 0.0 1.0 12,015 76
1,013 7.2
CAT_SCHEMA_32
/u02/app/oracle/oradata/catgt/cat_schema01_32.dbf
9 0 0.0 1.0
9 0 0 0.0
UNDOTBS1
/u01/app/oracle/oradata/catgt/undotbs01.dbf
9 0 0.0 1.0 16,205 103 549 237.1
USERS
/u02/app/oracle/oradata/catgt/users01.dbf
9 0 0.0 1.0 9 0 0 0.0
USERS
/u03/app/oracle/oradata/catgt/users02.dbf
9 0 0.0 1.0 9 0 0 0.0
-------------------------------------------------------------
Buffer Pool
Statistics DB/Inst: CATGT/catgt Snaps:
911-912
-> Standard
block size Pools D: default, K: keep, R: recycle
-> Default
Pools for other block sizes: 2k, 4k, 8k, 16k, 32k
Free
Writ Buffer
Number of
Pool Buffer Physical Physical Buff Comp
Busy
P Buffers
Hit% Gets Reads Writes Wait Wait
Waits
--- ----------
---- -------------- ------------ ----------- ---- ----
----------
D 418,624
100 3,008,364 12 62,472 0 0 4,329
32k 15,210
N/A 0 0 0 0 0 0
K 1,984
N/A 0 0 0 0 0 0
-------------------------------------------------------------
Instance
Recovery Stats DB/Inst: CATGT/catgt Snaps:
911-912
-> B:
Begin snapshot, E: End snapshot
Targt Estd Log File Log
Ckpt Log Ckpt
MTTR MTTR Recovery Actual
Target Size Timeout Interval
(s) (s)
Estd IOs Redo Blks Redo Blks Redo Blks Redo Blks Redo Blks
- ----- -----
---------- --------- --------- ---------- --------- ------------
B 0
26 13836 221628 184320 184320 458723
N/A
E 0
27 10351 206480 184320 184320 454362
N/A
-------------------------------------------------------------
Buffer Pool
Advisory DB/Inst: CATGT/catgt Snap:
912
-> Only rows
with estimated physical reads >0 are displayed
-> ordered by
Block Size, Buffers For Estimate
Est
Phys
Size for
Size Buffers for Read Estimated
P Est (M)
Factor Estimate Factor Physical Reads
--- --------
------ ---------------- ------ ------------------
D
336 .1 41,664 1.9 361,456
D
672 .2 83,328 1.3 253,294
D
1,008 .3 124,992 1.1 214,389
D
1,344 .4 166,656 1.1 206,081
D
1,680 .5 208,320 1.1 201,681
D
2,016 .6 249,984 1.0 199,438
D
2,352 .7 291,648 1.0 198,868
D
2,688 .8 333,312 1.0 198,145
D
3,024 .9 374,976 1.0 195,909
D 3,360
1.0 416,640 1.0 191,842
D 3,376
1.0 418,624 1.0 191,575
D 3,696
1.1 458,304 1.0 186,226
D 4,032
1.2 499,968 1.0 183,166
D 4,368
1.3 541,632 1.0 183,094
D 4,704
1.4 583,296 1.0 183,025
D 5,040
1.5 624,960 1.0 182,996
D 5,376
1.6 666,624 1.0 182,989
D 5,712
1.7 708,288 1.0 182,989
D 6,048
1.8 749,952 1.0 182,989
D 6,384
1.9 791,616 1.0 182,989
D 6,720
2.0 833,280 1.0 182,989
K 16
1.0 1,984 1.0 923
K 32
2.0 3,968 1.0 923
32k
48 .1 1,521 1.0 8,033
32k
96 .2 3,042 1.0 8,033
32k
144 .3 4,563 1.0 8,033
32k
192 .4 6,084 1.0 8,033
32k
240 .5 7,605 1.0 8,033
32k
288 .6 9,126 1.0 8,033
32k
336 .7 10,647 1.0 8,033
32k
384 .8 12,168 1.0 8,033
32k
432 .9 13,689 1.0 8,033
32k 480
1.0 15,210 1.0 8,033
32k 528
1.1 16,731 1.0 8,033
32k 576
1.2 18,252 1.0 8,033
32k 624
1.3 19,773 1.0 8,033
32k 672
1.4 21,294 1.0 8,033
32k 720
1.5 22,815 1.0 8,033
32k 768
1.6 24,336 1.0 8,033
32k 816
1.7 25,857 1.0 8,033
32k 864
1.8 27,378 1.0 8,033
32k 912
1.9 28,899 1.0 8,033
32k 960
2.0 30,420 1.0 8,033
-------------------------------------------------------------
PGA Aggr
Summary DB/Inst: CATGT/catgt Snaps:
911-912
-> PGA cache
hit % - percentage of W/A (WorkArea) data processed only
in-memory
PGA Cache Hit
% W/A MB Processed Extra W/A MB Read/Written
--------------- ------------------ --------------------------
100.0 37 0
-------------------------------------------------------------
PGA Aggr Target
Stats DB/Inst: CATGT/catgt Snaps: 911-912
-> B: Begin
snap E: End snap (rows dentified with B or E contain data
which is
absolute i.e. not diffed over the interval)
-> Auto PGA
Target - actual workarea memory target
-> W/A PGA
Used - amount of memory used for all Workareas (manual +
auto)
-> %PGA W/A
Mem - percentage of PGA memory allocated to workareas
-> %Auto W/A
Mem - percentage of workarea memory controlled by Auto Mem
Mgmt
-> %Man W/A
Mem - percentage of workarea memory under manual control
%PGA %Auto
%Man
PGA Aggr
Auto PGA PGA Mem W/A PGA W/A W/A W/A Global Mem
Target(M)
Target(M) Alloc(M) Used(M) Mem Mem Mem Bound(K)
- ----------
---------- ---------- ---------- ------ ------ ------ ----------
B
1,554 1,119 591.0 0.0 .0 .0 .0
159,120
E
1,554 1,097 642.5 0.0 .0 .0 .0
159,120
-------------------------------------------------------------
PGA Aggr Target
Histogram DB/Inst: CATGT/catgt Snaps: 911-912
-> Optimal
Executions are purely in-memory operations
Low High
Optimal
Optimal Total Execs Optimal Execs 1-Pass Execs M-Pass Execs
------- -------
-------------- -------------- ------------ ------------
2K
4K 254 254 0 0
64K
128K 5 5 0 0
512K
1024K 17 17 0 0
1M
2M 21 21 0 0
-------------------------------------------------------------
PGA Memory
Advisory DB/Inst: CATGT/catgt Snap:
912
-> When using
Auto Memory Mgmt, minimally choose a pga_aggregate_target value
where Estd
PGA Overalloc Count is 0
Estd Extra Estd PGA
Estd PGA
PGA Target
Size W/A MB W/A MB Read/ Cache Overalloc
Est (MB)
Factr Processed Written to Disk Hit % Count
----------
------- ---------------- ---------------- -------- ----------
194
0.1 80,166.5 1,333.5 98.0 32
389
0.3 80,166.5 111.3 100.0 0
777
0.5 80,166.5 111.3 100.0 0
1,166
0.8 80,166.5 111.3 100.0 0
1,554
1.0 80,166.5 111.3 100.0 0
1,865
1.2 80,166.5 0.0 100.0 0
2,176
1.4 80,166.5 0.0 100.0 0
2,486
1.6 80,166.5 0.0 100.0 0
2,797
1.8 80,166.5 0.0 100.0 0
3,108
2.0 80,166.5 0.0 100.0 0
4,662
3.0 80,166.5 0.0 100.0 0
6,216
4.0 80,166.5 0.0 100.0 0
9,324
6.0 80,166.5 0.0 100.0 0
12,432
8.0 80,166.5 0.0 100.0 0
-------------------------------------------------------------
Shared Pool
Advisory DB/Inst: CATGT/catgt Snap:
912
-> SP: Shared
Pool Est LC: Estimated Library Cache Factr: Factor
-> Note there
is often a 1:Many correlation between a single logical object
in the
Library Cache, and the physical number of memory objects
associated
with it.
Therefore comparing the number of Lib Cache objects (e.g. in
v$librarycache), with the number of Lib Cache Memory Objects is
invalid.
Est LC Est LC Est LC
Est LC
Shared
SP Est LC Time Time Load Load Est
LC
Pool
Size Size Est LC Saved Saved Time Time
Mem
Size(M)
Factr (M) Mem Obj (s) Factr (s) Factr Obj
Hits
----------
----- -------- ------------ ------- ------ ------- ------
-----------
240
.4 78 5,960 ####### 1.0 15,343 1.0
32,952,698
304
.5 133 7,109 ####### 1.0 15,000 1.0
33,029,884
368
.6 195 8,907 ####### 1.0 14,817 1.0
33,078,127
432
.7 258 13,240 ####### 1.0 14,742 1.0
33,103,680
496
.8 321 18,622 ####### 1.0 14,695 1.0
33,121,281
560
.9 384 20,309 ####### 1.0 14,661 1.0
33,133,155
624
1.0 447 21,858 ####### 1.0 14,636 1.0
33,141,076
688
1.1 510 23,427 ####### 1.0 14,618 1.0
33,147,297
752
1.2 573 24,988 ####### 1.0 14,602 1.0
33,152,513
816
1.3 636 26,555 ####### 1.0 14,587 1.0
33,156,849
880
1.4 699 28,091 ####### 1.0 14,568 1.0
33,161,084
944
1.5 762 29,657 ####### 1.0 14,549 1.0
33,166,020
1,008
1.6 825 31,214 ####### 1.0 14,526 1.0
33,171,765
1,072
1.7 888 32,741 ####### 1.0 14,499 1.0
33,178,476
1,136
1.8 951 34,295 ####### 1.0 14,467 1.0
33,185,402
1,200
1.9 1,014 35,838 ####### 1.0 14,436 1.0
33,191,207
1,264
2.0 1,077 37,410 ####### 1.0 14,406 1.0
33,196,315
-------------------------------------------------------------
SGA Target
Advisory DB/Inst: CATGT/catgt Snap:
912
SGA Target
SGA Size Est DB Est Physical
Size (M)
Factor Time (s) Reads
----------
---------- ------------ ----------------
1,188 0.3 571,546 344,663
2,376 0.5 570,178 245,178
3,564 0.8 569,950 199,295
4,752 1.0 569,950 191,575
5,940 1.3 569,950 177,015
7,128 1.5 569,950 176,843
8,316 1.8 569,988 176,843
9,504 2.0 569,992 176,881
-------------------------------------------------------------
Streams Pool
Advisory DB/Inst: CATGT/catgt Snap:
912
Size for
Size Est Spill Est Spill Est Unspill Est Unspill
Est (MB)
Factor Count Time (s) Count Time (s)
----------
--------- ----------- ----------- ----------- -----------
48 0.2 2,133,680 658 394,800 108
80 0.4 1,215,434 382 169,076 46
112 0.5 581,667 192 49,401 13
144 0.7 146,351 45 26,205 7
176 0.8 50,491 15 15,787 4
208 1.0
27,981 8 10,845 3
240 1.2 14,558 4 7,167 2
272 1.3 5,839 1 3,506 1
304 1.5 1,390 0 1,260 0
336 1.6 126 0 701 0
368 1.8 0 0 701 0
400 1.9 0 0 701 0
432 2.1 0 0 701 0
464 2.2 0 0 701 0
496 2.4 0 0 701 0
528 2.5 0 0 701 0
560 2.7 0 0 701 0
592 2.8 0 0 701 0
624 3.0 0 0 701 0
656 3.2 0 0 701 0
-------------------------------------------------------------
Java Pool
Advisory DB/Inst: CATGT/catgt Snap:
912
Est LC Est LC Est LC
Est LC
Java
JP Est LC Time Time Load Load Est
LC
Pool
Size Size Est LC Saved Saved Time Time
Mem
Size(M)
Factr (M) Mem Obj (s) Factr (s) Factr Obj
Hits
----------
----- -------- ------------ ------- ------ ------- ------
-----------
16
1.0 11 178 2 1.0 14,636 1.0
178
32
2.0 11 178 2 1.0 14,636 1.0
178
-------------------------------------------------------------
Buffer Wait
Statistics DB/Inst: CATGT/catgt Snaps:
911-912
-> ordered by
wait time desc, waits desc
Class Waits Total Wait Time (s) Avg Time
(ms)
------------------ ----------- -------------------
--------------
file header
block 310 146 472
data
block 3,600 25 7
undo
header 258 1 4
1st level
bmb 146 1 4
segment
header 2 0 5
-------------------------------------------------------------
Enqueue
Activity DB/Inst: CATGT/catgt Snaps:
911-912
-> only
enqueues with waits are shown
-> Enqueue
stats gathered prior to 10g should not be compared with 10g data
-> ordered by
Wait Time desc, Waits desc
Enqueue Type
(Request Reason)
------------------------------------------------------------------------------
Requests
Succ Gets Failed Gets Waits Wt Time (s) Av Wt Time(ms)
------------
------------ ----------- ----------- ------------ --------------
HW-Segment High
Water Mark
10,227 10,212 0 275
805 2,928.11
SQ-Sequence Cache
6,671 6,660 0 3,050
631 207.00
TX-Transaction (index contention)
1,589 1,588 0 1,565
8 5.35
US-Undo Segment
4,415 4,415 0 55 1
10.73
CF-Controlfile
Transaction
622 621 1 7 0
34.29
TX-Transaction
81,951
81,951 0 2 0 15.00
FB-Format Block
429 429 0 5 0
4.00
TX-Transaction
(allocate ITL entry)
3 2 0 2 0
5.00
-------------------------------------------------------------
Latch
Activity DB/Inst: CATGT/catgt Snaps:
911-912
-> "Get
Requests", "Pct Get Miss" and "Avg Slps/Miss" are statistics for
willing-to-wait latch get requests
-> "NoWait
Requests", "Pct NoWait Miss" are for no-wait latch get requests
-> "Pct Misses"
for both should be very close to 0.0
Pct Avg
Wait Pct
Get Get Slps
Time NoWait NoWait
Latch
Name Requests Miss /Miss (s)
Requests Miss
------------------------ -------------- ------ ------ ------
------------ ------
AQ Propagation
Schedulin 144 0.0 N/A 0 0
N/A
AWR Alerted
Metric Eleme 638 0.0 N/A 0 0
N/A
Consistent
RBA 10,462 0.0 N/A 0
0 N/A
FAL request
queue 22 0.0 N/A 0 0
N/A
FAL subheap
alocation 22 0.0 N/A 0 0
N/A
FIB s.o chain
latch 278 0.0 N/A 0 0
N/A
FOB s.o list
latch 418 0.0 N/A 0 0
N/A
JS queue state
obj latch 1,188 0.0 N/A 0 0
N/A
JS slv state
obj latch 9 0.0 N/A 0 0
N/A
KGX 0 N/A N/A
0 134,328 1.5
KMG MMAN ready
and start 55 0.0 N/A 0 0
N/A
KTF sga
latch 0 N/A N/A 0
51 0.0
KWQMN job cache
list lat 19 0.0 N/A 0 0 N/A
KWQP Prop
Status 424 0.0 N/A 0
0 N/A
MQL Tracking
Latch 0 N/A N/A 0 3
0.0
Memory
Management Latch 0 N/A N/A 0
55 0.0
Memory
Queue 308,336 0.0 0.0 0
0 N/A
Memory Queue
Message Sub 123,014 0.0 0.0 0 0
N/A
Memory Queue
Subscriber 184,967 0.1 0.1 0 0
N/A
OS
process 33 0.0 N/A
0 0 N/A
OS process
allocation 76 0.0 N/A 0
0 N/A
OS process:
request allo 9 0.0 N/A 0 0
N/A
PL/SQL warning
settings 293 0.0 N/A 0 0
N/A
SGA IO buffer
pool latch 1,327 0.0 N/A 0 2,035
0.0
SQL memory
manager latch 1 0.0 N/A 0
52 0.0
SQL memory
manager worka 3,971 0.0 N/A 0
0 N/A
STREAMS
LCR 122,800 0.0 N/A 0
0 N/A
STREAMS Pool
Advisor 0 N/A N/A 0 27
0.0
Shared
B-Tree 555,604 0.0 0.0 0
0 N/A
Streams
Generic 123,014 0.0 0.0 0
0 N/A
Undo Hint
Latch 0 N/A N/A 0
321 0.0
active
checkpoint queue 210 0.0 N/A 0
0 N/A
active service
list 363 0.0 N/A 0 67
0.0
archive
control 33 0.0 N/A 0
0 N/A
archive process
latch 74 0.0 N/A 0 0 N/A
begin backup
scn array 2 0.0 N/A 0 0
N/A
bq:time manger
info latc 12 0.0 N/A 0 0
N/A
bufq
statistics 52 0.0 N/A
0 0 N/A
cache buffer
handles 9,316 0.0 N/A 0 0
N/A
cache buffers
chains 11,164,267 0.0 0.4 7 34,039
0.0
cache buffers
lru chain 224,038 0.1 0.2 1 925
0.3
cas
latch 100 0.0 N/A
0 0 N/A
channel handle
pool latc 9 0.0 N/A 0 0
N/A
channel
operations paren 300,191 0.1 0.0 0
0 N/A
checkpoint
queue latch 66,582 0.0 0.0 0
58,090 0.1
client/application info 214 0.0 N/A
0 0 N/A
commit callback
allocati 26 0.0 N/A 0 0 N/A
compile
environment latc 98,341 0.0 0.6 0
0 N/A
dml lock
allocation 2,267,945 0.8 0.0 5
0 N/A
dummy
allocation 15 0.0 N/A
0 0 N/A
enqueue hash
chains 2,499,180 0.3 0.2 9 3,109
0.1
enqueues 142,264 0.1 0.4
0 0 N/A
event group
latch 4 0.0 N/A 0 0
N/A
file cache
latch 1,326 0.1 1.0 0
0 N/A
global KZLD
latch for me 1 0.0 N/A 0 0
N/A
hash table
column usage 0 N/A N/A 0
437 0.0
job workq
parent latch 0 N/A N/A 0
6 0.0
job_queue_processes para 6 0.0 N/A
0 0 N/A
kks
stats 1,983 0.2 1.0
0 0 N/A
ksuosstats
global area 13 0.0 N/A 0
0 N/A
kwqbsgn:msghdr 246,028 0.0 0.0
0 0 N/A
kwqbsn:qsga 328 0.0 N/A
0 27 0.0
lgwr LWN
SCN 10,468 0.0 N/A 0
0 N/A
library
cache 6,964,573 0.3 0.3 172
276 4.0
library cache
load lock 4 0.0 N/A 0 0
N/A
library cache
lock 3,306,580 0.0 0.5 1 0
N/A
library cache
lock alloc 322 0.0 N/A 0 0
N/A
library cache
pin 4,927,217 0.1 0.2 8 0
N/A
library cache
pin alloca 3,283 0.0 N/A 0 0
N/A
list of block
allocation 85 0.0 N/A 0 0
N/A
loader state
object free 110 0.0 N/A 0 0
N/A
logminer
context allocat 3 0.0 N/A 0
0 N/A
logminer work
area 815,042 0.5 0.0 0 0
N/A
longop free
list parent 67 0.0 N/A 0 0
N/A
message pool
operations 122,620 0.0 0.0 0 0
N/A
messages 26,564 0.0 0.0
0 0 N/A
mostly
latch-free SCN 117,639 0.0 0.8 0
0 N/A
multiblock read
objects 4 0.0 N/A 0 0 N/A
ncodef
allocation latch 9 0.0 N/A 0
0 N/A
object queue
header heap 1 0.0 N/A 0 0
N/A
object queue
header oper 227,358 0.1 0.2 0 0
N/A
object stats
modificatio 1 0.0 N/A 0 0
N/A
parallel query
alloc buf 20 0.0 N/A 0 0
N/A
parameter
list 1 0.0 N/A 0
0 N/A
parameter table
allocati 8 0.0 N/A 0 0 N/A
post/wait
queue 40,376 0.0 0.3 0
74,125 0.1
process
allocation 9 0.0 N/A 0
4 0.0
process group
creation 9 0.0 N/A 0 0
N/A
process queue
reference 664 0.0 N/A 0 332
0.0
qmn task queue
latch 189 0.0 N/A 0 0
N/A
queue sender's
info. lat 246,428 0.0 0.0 0 0
N/A
redo
allocation 37,565 0.7 0.7 0
963,938 0.5
redo
copy 51 72.5 1.0 1
964,706 0.8
redo on-disk
SCN 32,113 0.0 N/A 0 0
N/A
redo
writing 36,570 0.0 0.8
0 0 N/A
resmgr group
change latc 60 0.0 N/A 0 0
N/A
resmgr:actses
active lis 38 0.0 N/A 0 0
N/A
resmgr:actses
change gro 48 0.0 N/A 0 0
N/A
resmgr:free
threads list 15 0.0 N/A 0 0
N/A
resmgr:schema
config 1 0.0 N/A 0 0
N/A
rm cas
latch 88 0.0 N/A 0
0 N/A
row cache
objects 1,734,550 0.0 0.0 0
0 N/A
rules engine
aggregate s 30,704 0.0 N/A 0 0
N/A
rules engine
rule set st 92,208 0.0 N/A 0 0
N/A
rules engine
rule statis 30,700 0.0 N/A 0 0
N/A
sequence
cache 231,894 0.2 0.3 1
0 N/A
session
allocation 202,654 0.2 0.6 1
0 N/A
session idle
bit 493,415 0.0 0.4 0 0
N/A
session state
list latch 19 0.0 N/A 0 0
N/A
session
switching 9 0.0 N/A 0
0 N/A
session
timer 67 0.0 N/A 0
0 N/A
shared
pool 1,002,666 0.1 0.1 4
0 N/A
simulator hash
latch 268,782 0.0 N/A 0 0
N/A
simulator lru
latch 263,771 0.4 0.3 2 1,745
0.1
sort extent
pool 13 0.0 N/A 0 0
N/A
state object
free list 2 0.0 N/A 0 0
N/A
statistics
aggregation 140 0.0 N/A 0
0 N/A
temp lob
duration state 1 0.0 N/A 0
0 N/A
threshold
alerts latch 7 0.0 N/A 0
0 N/A
transaction
allocation 727 0.0 N/A 0 0
N/A
transaction
branch alloc 9 0.0 N/A 0 0
N/A
undo global
data 310,089 0.1 0.2 0 1
0.0
user
lock 12 0.0 N/A
0 0 N/A
-------------------------------------------------------------
Latch Sleep
Breakdown DB/Inst: CATGT/catgt Snaps: 911-912
-> ordered by
misses desc
Latch Name
----------------------------------------
Get
Requests Misses Sleeps Spin Gets Sleep1 Sleep2
Sleep3
--------------
----------- ----------- ---------- -------- -------- --------
library cache
6,964,573 23,102 8,020 15,248 0
0 0
dml lock
allocation
2,267,945 18,080 754 17,333 0
0 0
enqueue hash
chains
2,499,180 8,118 1,312 6,827 0
0 0
library cache
pin
4,927,217 4,167 958 3,215 0
0 0
logminer work
area
815,042 3,753 94 3,688 0
0 0
cache buffers
chains
11,164,267 3,360 1,214 2,155 0
0 0
shared pool
1,002,666 1,405 207 1,201 0
0 0
simulator lru
latch
263,771 1,004 329 679 0
0 0
sequence cache
231,894 508 128 381 0
0 0
row cache
objects
1,734,550 443 8 436 0
0 0
session
allocation
202,654 441 264 180 0
0 0
cache buffers
lru chain
224,038 269 66 204 0
0 0
redo allocation
37,565 245 166 103 0
0 0
channel
operations parent latch
300,191 212 1 211 0
0 0
undo global
data
310,089 176 43 134 0
0 0
object queue
header operation
227,358 164 36 128 0
0 0
session idle
bit
493,415 161 61 100 0
0 0
library cache
lock
3,306,580 155 71 84 0
0 0
Memory Queue
Subscriber
184,967 133 7 126 0
0 0
enqueues
142,264 86 32 54 0
0 0
Shared B-Tree
555,604 65 1 64 0
0 0
kwqbsgn:msghdr
246,028 62 2 60 0
0 0
Streams Generic
123,014 53 1 52 0
0 0
redo copy
51 37 38 0 0 0 0
compile
environment latch
98,341 33 21 12 0
0 0
mostly
latch-free SCN
117,639 29 22 8 0
0 0
Memory Queue
308,336 24 1 23 0
0 0
post/wait queue
40,376 15 4 11 0
0 0
kks stats
1,983 4 4 0 0
0 0
redo writing
36,570 4 3 2 0
0 0
Latch Sleep
Breakdown DB/Inst: CATGT/catgt Snaps: 911-912
-> ordered by
misses desc
Latch Name
----------------------------------------
Get
Requests Misses Sleeps Spin Gets Sleep1 Sleep2
Sleep3
--------------
----------- ----------- ---------- -------- -------- --------
file cache
latch
1,326 1 1 0 0
0 0
-------------------------------------------------------------
Latch Miss
Sources DB/Inst: CATGT/catgt Snaps:
911-912
-> only latches
with sleeps are shown
-> ordered by
name, sleeps desc
NoWait Waiter
Latch
Name Where Misses
Sleeps Sleeps
------------------------ -------------------------- -------
---------- --------
Memory
Queue kgqmmsg_change 0
1 1
Memory Queue
Subscriber kgqmdeq 0 4
0
Memory Queue
Subscriber kgqmenq 0 2
4
Memory Queue
Subscriber kgqmbws 0 1
3
Shared
B-Tree kgqbtqry 0
1 1
Streams
Generic kngoonew 0
1 1
cache buffers
chains kcbget: exchange rls 0 634
1
cache buffers
chains kcbgcur: kslbegin 0 123
724
cache buffers
chains kcbnlc 0 109
24
cache buffers
chains kcbrls: kslbegin 0 109
1
cache buffers
chains kcbgtcr: fast path 0 98
86
cache buffers
chains kcbget: pin buffer 0 62
298
cache buffers
chains kcbchg: kslbegin: call CR 0 32
0
cache buffers
chains kcbget: exchange 0 22
4
cache buffers
chains kcbgtcr: kslbegin excl 0 11
52
cache buffers
chains kcbchg: kslbegin: bufs not 0 3
9
cache buffers
chains kcbzwb 0 1
3
cache buffers
lru chain kcbzgws_1 0 42
44
cache buffers
lru chain kcbzgb: posted for free bu 0 22
22
cache buffers
lru chain kcbbxsv: move to being wri 0 2
0
channel
operations paren ksrapublish() 0
1 0
compile
environment latc qksceCopyEnv 0
21 21
dml lock
allocation ktaidm 0
475 156
dml lock
allocation ktaiam 0
279 598
enqueue hash
chains ksqrcl 0 752
260
enqueue hash
chains ksqgtl3 0 559
1,038
enqueue hash
chains ksqcmi: get hash chain lat 0 4
19
enqueue hash
chains ksqcnl 0 1
0
enqueue hash
chains ksucallcbksafely: ksqhngcb 0 1
0
enqueues ksqies
0 29 30
enqueues ksqgel: create enqueue
0 3 2
file cache
latch file cache:04 0
1 1
kks
stats kks stats alloc/free 0
4 4
kwqbsgn:msghdr kwqbcfmsg: latch
0 2 0
library
cache kglpndl: child: before pro 0
2,572 3,719
library
cache kglpnp: child 0
1,430 723
library
cache kgldte: child 0 0
1,311 10
library
cache kglobpn: child: 0
543 1,183
library
cache kglpin: child: heap proces 0
497 813
library
cache kglhdgn: child: 0
491 1,448
library
cache kglpndl: child: after proc 0
480 4
library
cache kgldti: 2child 0
191 25
library
cache kglpin 0
67 3
library
cache kglpnc: child 0
61 17
library
cache kglukp: child 0
38 4
library
cache kglrtl 0
23 1
library
cache kglobld 0
18 8
library
cache kglhdgc: child: 0
17 0
library cache
lock kgllkdl: child: cleanup 0 69
66
library cache
lock kgllkdl: child: no lock ha 0 43
55
library cache
lock kgllkal: child: multiinsta 0 2
5
library cache
pin kglpndl 0 562
477
library cache
pin kglpnp: child 0 260
170
library cache
pin kglpnal: child: alloc spac 0 129
306
library cache
pin kglpnc: child 0 6
5
library cache
pin kgldnp: child 0 1
0
logminer work
area krvuarm 0 48
3
logminer work
area krvxrgr 0 13
21
logminer work
area krvxbtpp 0 10
0
logminer work
area krvxprep 0 7
1
Latch Miss
Sources DB/Inst: CATGT/catgt Snaps:
911-912
-> only latches
with sleeps are shown
-> ordered by
name, sleeps desc
NoWait Waiter
Latch
Name Where Misses
Sleeps Sleeps
------------------------ -------------------------- -------
---------- --------
logminer work
area krvtadc 0 5
3
logminer work
area krvxrarwq 0 3
2
logminer work
area krvxbrta 0 2
2
logminer work
area krvutcmi 0 1
0
logminer work
area krvxbhlm 0 1
1
logminer work
area krvxbuild 0 1
33
logminer work
area krvxgti 0 1
0
logminer work
area krvxpin 0 1
0
logminer work
area krvxrti 0 1
0
mostly
latch-free SCN kcs02 0
22 22
object queue
header oper kcbo_switch_cq 0 29
32
object queue
header oper kcbw_link_q 0 5
4
object queue
header oper kcbo_switch_q_bg 0 1
0
object queue
header oper kcbw_unlink_q 0 1
1
post/wait
queue ksliwat:add:nowait 0
4 0
redo
allocation kcrfw_redo_gen: redo alloc 0
155 0
redo
allocation kcrfw_redo_write: before w 0
5 20
redo
allocation kcrfw_redo_gen: redo alloc 0
4 43
redo
allocation kcrfw_redo_write: more spa 0
2 103
redo
copy kcrfw_redo_gen: nowait 0
34 0
redo
copy kcrfw_redo_gen: wait 0
4 50
redo
writing kcrfsr: rba scn pair 0
3 0
row cache
objects kqreqd: reget 0
6 0
row cache
objects kqrpre: find obj 0
2 8
sequence
cache kdnssd 0
100 0
sequence
cache kdnnxt: cached seq 0
19 1
sequence
cache kdnss 0
9 127
session
allocation ksuxds: not user session 0
148 111
session
allocation ksucri 0
116 153
session idle
bit ksupuc: clear busy 0 34
15
session idle
bit ksuxds 0 16
29
session idle
bit ksupuc: set busy 0 11
17
shared
pool kghfrunp: clatch: nowait 0
232 0
shared
pool kghalo 0
155 118
shared
pool kghupr1 0
25 84
shared
pool kghfre 0
20 3
shared
pool kghfrunp: clatch: wait 0
6 7
shared
pool kghfrunp: alloc: cursor du 0
4 1
shared pool
kghalp 0 3
0
simulator lru
latch kcbs_simulate: simulate se 0 329
328
undo global
data ktudnx:child 0
25 7
undo global
data ktudba: KSLBEGIN 0
14 8
undo global
data ktusmupst: KSLBEGIN 0
3 1
undo global
data ktufrbs: child 0 1
26
-------------------------------------------------------------
Segments by
Logical Reads DB/Inst: CATGT/catgt Snaps:
911-912
-> Total
Logical Reads: 3,004,751
-> Captured
Segments account for 91.0% of Total
Tablespace Subobject Obj. Logical
Owner
Name Object Name Name Type Reads
%Total
---------- ---------- -------------------- ---------- -----
------------ -------
CAT_SCHEMA CAT_SCHEMA XPKIM_DONALDS INDEX
299,504 9.97
CAT_SCHEMA
CAT_SCHEMA FBI_DONALD TOURISTS TABLE 253,744
8.44
CAT_SCHEMA
CAT_SCHEMA XIF15FBI_DONALD INDEX 224,544
7.47
CAT_SCHEMA
CAT_SCHEMA XIF14FBI_DONALD INDEX 223,120
7.43
CAT_SCHEMA
CAT_SCHEMA XIF7FBI_DONALD INDEX 221,824
7.38
-------------------------------------------------------------
Segments by
Physical Reads DB/Inst: CATGT/catgt Snaps:
911-912
-> Total
Physical Reads: 110
-> Captured
Segments account for 9.1% of Total
Tablespace Subobject Obj. Physical
Owner
Name Object Name Name Type Reads
%Total
----------
---------- -------------------- ---------- ----- ------------
-------
SYS
SYSAUX WRH$_ACTIVE_SESSION_ 152563_902 TABLE 10
9.09
-------------------------------------------------------------
Segments by Row
Lock Waits DB/Inst: CATGT/catgt Snaps: 911-912
-> % of Capture
shows % of row lock waits for each top segment compared
-> with total
row lock waits for all segments captured by the Snapshot
Row
Tablespace Subobject Obj. Lock
% of
Owner
Name Object Name Name Type Waits
Capture
---------- ---------- -------------------- ---------- -----
------------ -------
CAT_SCHEMA CAT_SCHEMA XPKIM_DONALDS
INDEX 1,366 86.02
CAT_SCHEMA CAT_SCHEMA XIF1FBI_DONALD
INDEX 135 8.50
CAT_SCHEMA CAT_SCHEMA XIF12FBI_DONALD
INDEX 52 3.27
CAT_SCHEMA CAT_SCHEMA XIF15FBI_DONALD
INDEX 19 1.20
CAT_SCHEMA CAT_SCHEMA XIF6FBI_DONALD
INDEX 12 .76
-------------------------------------------------------------
Segments by ITL
Waits DB/Inst: CATGT/catgt Snaps: 911-912
-> % of Capture
shows % of ITL waits for each top segment compared
-> with total
ITL waits for all segments captured by the Snapshot
Tablespace Subobject Obj. ITL
% of
Owner
Name Object Name Name Type Waits
Capture
---------- ---------- -------------------- ---------- -----
------------ -------
CAT_SCHEMA CAT_SCHEMA XIF1FBI_DONALD
INDEX 1 50.00
CAT_SCHEMA CAT_SCHEMA XIF6FBI_DONALD
INDEX 1 50.00
-------------------------------------------------------------
Segments by
Buffer Busy Waits DB/Inst: CATGT/catgt Snaps:
911-912
-> % of Capture
shows % of Buffer Busy Waits for each top segment compared
-> with total
Buffer Busy Waits for all segments captured by the Snapshot
Buffer
Tablespace Subobject Obj. Busy
% of
Owner
Name Object Name Name Type Waits
Capture
---------- ---------- -------------------- ---------- -----
------------ -------
CAT_SCHEMA CAT_SCHEMA XPKIM_DONALDS
INDEX 2,768 73.85
CAT_SCHEMA CAT_SCHEMA XIF1FBI_DONALD
INDEX 372 9.93
CAT_SCHEMA CAT_SCHEMA XIF12FBI_DONALD
INDEX 190 5.07
CAT_SCHEMA CAT_SCHEMA FBI_DONALD TOURISTS
TABLE 176 4.70
CAT_SCHEMA CAT_SCHEMA XIF15FBI_DONALD
INDEX 109 2.91
-------------------------------------------------------------
Dictionary
Cache Stats DB/Inst: CATGT/catgt Snaps:
911-912
-> "Pct
Misses" should be very low (< 2% in most cases)
-> "Final
Usage" is the number of cache entries being used
Get Pct Scan Pct
Mod Final
Cache Requests Miss Reqs Miss
Reqs Usage
------------------------- ------------ ------ ------- -----
-------- ----------
dc_awr_control 8 0.0 0
N/A 2 1
dc_database_links 288 0.0 0
N/A 0 4
dc_global_oids 123,107 0.0 0
N/A 0 67
dc_histogram_data 4,565 0.0 0
N/A 0 5,983
dc_histogram_defs 4,968 0.0 0
N/A 0 5,557
dc_object_grants 60 0.0 0
N/A 0 232
dc_object_ids 158,443 0.0 0
N/A 0 1,622
dc_objects 2,002 0.0 0
N/A 0 1,808
dc_profiles 4 0.0 0
N/A 0 2
dc_rollback_segments 14,842 0.0 0
N/A 17 32
dc_segments 38,146 0.0 0
N/A 59 1,800
dc_sequences 3,700 0.0 0 N/A
3,700 9
dc_tablespace_quotas 39 0.0 0
N/A 39 2
dc_tablespaces 21,267 0.0 0
N/A 0 10
dc_usernames 62,790 0.0 0
N/A 0 26
dc_users 141,997 0.0 0
N/A 0 84
outstanding_alerts 4 50.0 0
N/A 4 19
-------------------------------------------------------------
Library Cache
Activity DB/Inst: CATGT/catgt Snaps: 911-912
-> "Pct
Misses" should be very low
Get Pct
Pin Pct Invali-
Namespace Requests Miss Requests Miss
Reloads dations
---------------
------------ ------ -------------- ------ ---------- --------
BODY 190 0.0 176,595
0.0 0 0
INDEX 1 0.0 12
0.0 0 0
SQL
AREA 1 0.0 164,974 1.1
910 0
TABLE/PROCEDURE 91 0.0 436,553
0.0 2 0
TRIGGER 5 0.0 123,989
0.0 0 0
-------------------------------------------------------------
Process Memory
Summary DB/Inst: CATGT/catgt Snaps: 911-912
-> B:
Begin snap E: End snap
-> All rows
below contain absolute values (i.e. not diffed over the
interval)
-> Max Alloc is
Maximum PGA Allocation size at snapshot time
-> Hist Max
Alloc is the Historical Max Allocation for still-connected
processes
-> ordered by
Begin/End snapshot, Alloc (MB) desc
Hist
Avg Std Dev Max Max
Alloc Used Alloc Alloc
Alloc Alloc Num Num
Category
(MB) (MB) (MB) (MB) (MB) (MB) Proc Alloc
- --------
--------- --------- -------- -------- ------- ------- ------
------
B Other
509.3 N/A 6.1 7.8 49 49 83 83
Freeable
74.1 .0 1.2 3.6 28 N/A 63 63
PL/SQL 4.8 1.6 .1 .1 1
1 81 81
SQL 2.9 1.5 .0 .1 0
31 74 69
E Other
557.9 N/A 6.8 8.0 49 49 82 82
Freeable
76.8 .0 1.1 3.5 28 N/A 67 67
PL/SQL 4.9 1.6 .1 .1 1
1 80 80
SQL
2.9 1.5 .0 .1 0 31
73 68
-------------------------------------------------------------
SGA Memory
Summary DB/Inst: CATGT/catgt Snaps:
911-912
End Size
(Bytes)
SGA
regions Begin Size (Bytes) (if
different)
------------------------------ -------------------
-------------------
Database
Buffers 4,060,086,272
Fixed
Size 2,030,408
Redo
Buffers 14,745,600
Variable
Size 2,365,588,664
-------------------
sum 6,442,450,944
-------------------------------------------------------------
SGA breakdown
difference DB/Inst: CATGT/catgt Snaps: 911-912
-> ordered by
Pool, Name
-> N/A value
for Begin MB or End MB indicates the size of that Pool/Name was
insignificant, or zero in that snapshot
Pool
Name Begin MB End MB %
Diff
------
------------------------------ -------------- --------------
-------
java free
memory 10.1 10.1 0.00
java joxlod
exec hp 5.8 5.8 0.00
large PX msg
pool .9 .9 0.00
large free
memory 15.1 15.1 0.00
shared
CCursor 34.6 33.2
-3.91
shared KGLS
heap 6.7 6.2 -7.53
shared
PCursor 27.7 25.6
-7.74
shared PL/SQL
MPCODE 8.3 8.3 -0.14
shared XDB
Schema Cac 7.2 7.2 0.00
shared
db_block_hash_buckets 16.8 16.8
0.00
shared free
memory 168.8 117.3 -30.52
shared kglsim
heap 5.8 5.8 0.00
shared kglsim
object batch 8.0 8.0 0.00
shared library
cache 55.2 55.1 -0.07
shared row
cache 7.1 7.1 0.00
shared sql
area 143.7 199.3 38.72
stream free
memory 92.1 92.2 0.06
stream internal
row lcr 25.1 25.1 0.00
stream
koicnfadt adt attr 163.3 163.3
0.00
stream kol
raw 154.1 154.2 0.02
stream kol
vstring 57.2 57.2 0.00
stream kolcalm
coll 168.6 168.6 0.00
stream kolccst
obj 879.8 879.8 0.00
stream kolcpcon
kolcol 26.0 26.0 0.00
buffer_cache 3,872.0 3,872.0
0.00
fixed_sga 1.9 1.9
0.00
log_buffer 14.1 14.1
0.00
-------------------------------------------------------------
Streams CPU/IO
Usage DB/Inst: CATGT/catgt Snaps: 911-912
-> Streams
processes ordered by CPU usage
-> CPU and I/O
Time in micro seconds
Session
Type CPU Time User I/O Time Sys I/O Time
------------------------- -------------- --------------
--------------
STREAMS
Capture 21,280,000 0 0
STREAMS Apply
Reader 6,099,450 20,501 13,413
Logminer Builder 1,858,357
0 0
Logminer Preparer 1,755,593
0 0
QMON
Slaves 1,328,880 0
0
Logminer
Reader 970,096 0 8,876,876
STREAMS Apply
Server 355,803 0 0
STREAMS Apply
Coordinator 7,475 0 0
QMON
Coordinator 4,540 0
0
Propagation
Sender 0 0 0
-------------------------------------------------------------
Streams
Capture DB/Inst: CATGT/catgt Snaps:
911-912
-> Lag Change
should be small or negative (in seconds)
Captured
Enqueued Pct Pct Pct Pct
Per Per Lag RuleEval
Enqueue RedoWait Pause
Capture Name
Second Second Change Time Time Time Time
------------
-------- -------- -------- -------- -------- -------- --------
CAPTURE_CAT 650 391 93 0 23
0 71
-------------------------------------------------------------
Streams
Apply DB/Inst: CATGT/catgt Snaps:
911-912
-> Pct DB is
the percentage of all DB transactions that this apply handled
-> WDEP is the
wait for dependency
-> WCMT is the
wait for commit
-> RBK is
rollbacks
-> MPS is
messages per second
-> TPM is time
per message in milli-seconds
-> Lag Change
should be small or negative (in seconds)
Applied Pct Pct Pct Pct Applied Dequeue Apply Lag
Apply
Name TPS DB WDEP WCMT RBK MPS TPM TPM
Change
------------
-------- ---- ---- ---- --- -------- -------- -------- --------
APPLY_CAT 0 0 0 0 0 0
0 0 0
-------------------------------------------------------------
Buffered
Queues DB/Inst: CATGT/catgt Snaps:
911-912
-> The Spill
Rate should be very close to zero
-> The Diff in
Percentage Spilled should be very close to zero or negative
Incoming Outgoing
Spilled Diff
Queue Schema
and Name per second per second per second Pct Spilled
--------------------- ----------- ----------- -----------
------------
STRMADMIN.REP_CAPTURE 391 391
0 0
STRMADMIN.REP_DEST_QU 0 0
0 0
-------------------------------------------------------------
Buffered
Subscribers DB/Inst: CATGT/catgt Snaps:
911-912
-> All
Subscribers should have a zero spill rate
Incoming Outgoing Spilled
Subscriber
Name per second per second per second
-------------------- ----------- ----------- -----------
APPLY_CAT 7,931 7,931 64
APPLY_CAT 0 0 0
PROXY:
"STRMADMIN"." 391 391 0
PROXY:
CATGJANET.GOV 0 0 0
PROXY:
CATGJANET.GOV -7,931 -7,931 -64
-------------------------------------------------------------
Rule
Set DB/Inst: CATGT/catgt
Snaps: 911-912
-> Rule Sets
ordered by Evaluations
Fast SQL CPU
Elapsed
Ruleset
Name Evals Evals Execs Time Time
------------------------- -------- -------- -------- --------
--------
STRMADMIN.RULESET$_106 30,772 0 30,772 1,385
2,464
SYS.ALERT_QUE_R 4 0 0
0 0
STRMADMIN.RULESET$_66 0 0 0
0 0
STRMADMIN.RULESET$_73 0 0 0
0 0
STRMADMIN.RULESET$_98 0 0 0
0 0
STRMADMIN.RULESET$_113 0 0 0
0 0
STRMADMIN.RULESET$_103 0 0 0
0 0
STRMADMIN.RULESET$_63 0 0 0
0 0
-------------------------------------------------------------
Resource Limit
Stats DB/Inst: CATGT/catgt Snap: 912
-> only rows
with Current or Maximum Utilization > 80% of Limit are shown
-> ordered by
resource name
Current Maximum Initial
Resource
Name Utilization Utilization Allocation
Limit
------------------------------ ------------ ------------
---------- ----------
sessions 129 150
170 170
-------------------------------------------------------------
init.ora
Parameters DB/Inst: CATGT/catgt Snaps:
911-912
End value
Parameter
Name Begin value (if
different)
----------------------------- ---------------------------------
--------------
_kgl_large_heap_warning_thres 8388608
_optimizer_cost_model CPU
audit_file_dest /u01/app/oracle/admin/catgt/adump
background_dump_dest /u01/app/oracle/admin/catgt/bdump
compatible 10.2.0.1.0
control_files /u01/app/oracle/oradata/catgt/con
core_dump_dest /u01/app/oracle/admin/catgt/cdump
cursor_sharing FORCE
db_32k_cache_size 503316480
db_block_size 8192
db_cache_size 16777216
db_domain gov.com
db_file_multiblock_read_count 16
db_keep_cache_size 16777216
db_name catgt
db_recovery_file_dest /u01/app/oracle/flash_recovery_ar
db_recovery_file_dest_size 2147483648
dispatchers (PROTOCOL=TCP) (SERVICE=catgtXDB)
global_names FALSE
java_pool_size 0
job_queue_processes 12
large_pool_size 0
log_archive_dest_1 LOCATION=/u03/app/oracle/oradata/
log_archive_format %t_%s_%r.arc
open_cursors 300
optimizer_index_caching 90
optimizer_index_cost_adj 50
optimizer_mode FIRST_ROWS
pga_aggregate_target 1629487104
processes 150
remote_login_passwordfile EXCLUSIVE
sga_max_size
6442450944
sga_target
4982833152
shared_pool_size 0
streams_pool_size 218103808
undo_management
AUTO
undo_retention
7200
undo_tablespace
UNDOTBS1
user_dump_dest
/u01/app/oracle/admin/catgt/udump
-------------------------------------------------------------
End of Report
|

|
|


