Each
new release of Oracle brings new tools and techniques for performance
optimization, but it's a formidable challenge to create tools that can
identify and correct database bottlenecks for every possible situation. I run a
large remote DBA operation, monitoring and tuning mission-critical
databases around the globe.
With such a large base of experience, I am in a unique position to see
hundreds of systems in-action and understand the best approaches to
achieve optimal performance.
This paper will attempt to present the unvarnished truth about which
Oracle tuning tools and techniques are the most effective.
Oracle Corporation is a cheerleader, saying that all of their
features are wonderful, and they are not always forthcoming about the
risks and rewards of using new tools and techniques.
For example, back in the last days of Oracle 7, word came forth
from Oracle Corporation that the Rule-based optimizer was being removed
from Oracle 8, and all shops must move quickly to adopt the cost-based
optimizer.
The cost-based
optimizer was not quite ready for primetime, much to the consternation
of those shops who had attempted to migrate to the CBO.
Even in 11g, we still see improvements to the CBO, and despite
dire warnings that the RBO will disappear, RULE hints appear in hundreds
of Oracle's own internal SQL statements.
This paper will begin with a review of my "best Practices" approach to
Oracle tuning; a practical approach and then see a historical
perspective by looking at the evolution of Oracle tuning tools and
techniques, and wrap-up with a pragmatic tuning approach which has
worked well in my company.
A best practices approach to Oracle tuning
Over the years, Oracle tuning experts have introduced many different
tuning methodologies and tools, each with their own benefits and
shortcomings. Each
proponent zealously advocated that their approach is the "best"
approach, and until Oracle 11g, Oracle Corporation remained silent about
an approved approach to Oracle tuning.
All of that changed in Oracle 11g, when Oracle's toolset made
definite recommendations of a "holistic" tuning approach with their
"Fully Automated SQL Tuning" feature.
Implemented via the SQL Performance Advisor (SPA), Oracle
attempts to automate a proven approach that has been used for more than
a decade by Oracle tuning experts:
- Top-down tuning - The Oracle University
performance tuning classes have always recommended tuning to the
global parameters before diving in to tune specific SQL statements,
but this has now become codified in the 11g SQL Performance
Analyzer, a tool which allows the DBA to capture real-world
workloads and test them in a controlled environment.
- Empirical tuning - Rather than rely on artificial
contrived "test cases" for tuning, Oracle 11g now endorses a
workload-based approach, where you eliminate the guesswork by
testing your changes with real-world data.
- Separation of proactive vs. reactive tuning activities
- With the introduction of the Automated Session History tables and
the AWR tables, Oracle Corporation made a clear distinction between
proactive and reactive tuning. Reactive tuning involves reacting to
an acute tuning crisis, while Oracle gives us the AWR tables to use
for long-term tuning, using predictive analytics to forecast
repeating performance bottlenecks.
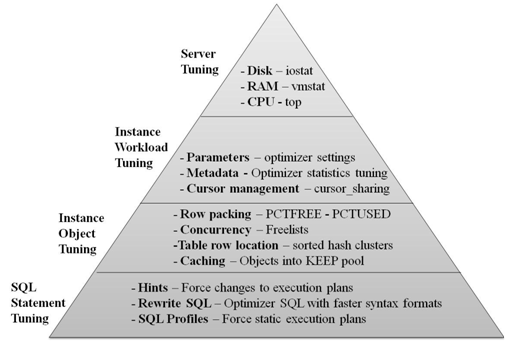
Before we explore the top-down approach to Oracle
tuning in detail, let's start with a quick review of the evolution of
Oracle tuning tools and techniques.
The History of Oracle tuning techniques
To fully appreciate the enhancements within Oracle 11g it's important to
take a historical perspective and understand the context of the
enhancements. Performance tuning has not changed much since Oracle 7, but
there are a wealth of new tools and techniques with each new release.
(See Appendix A for a full list of tuning features by release)
Oracle 7
In Oracle 7, Oracle Education (later Oracle University) advocated
"instance tuning", an approach whereby the database is tuned as a whole
by optimizing the critical init.ora parameters, CBO statistics and
object parameters. We also
saw these specific tuning features:
- Bitmap Indexes
- Partitioned Views
- Sequential prefetch for full table scans (asynchronous read
ahead)
- alter index xx rebuild syntax
- Advanced replication
Oracle 7 was in the days when a 300 megabyte SGA was considered large,
and DBA's tuned to very simple rules.
The Oracle Education DBA tuning course recommended simple
ratio-based tuning, and almost all Oracle databases were I/O-bound,
largely due to tiny RAM buffers.
Oracle 8
Oracle 8 was originally dubbed "Oracle Universal Server" (OUS) a
relational database with object-oriented features.
Incidentally, despite the great quality of Oracle implementation
of OODBMS, the object-oriented features never caught-on expect within
Oracle Corporation itself.
Oracle 8 improved upon many of the Oracle 7 tuning features (some of which
were too buggy for production) and gave us these meager new tuning
features:
- Table and Index partitioning enhancements
- reverse key indexes
- updatable views
- Oracle parallel query for DML (insert, update, delete)
In Oracle 8, the tuning professional received divide and conquer tools
that allowed the DBA to perform maintenance activities in parallel.
Oracle 8i
Dubbed "The Internet enabled database", Oracle 8i concentrated on
enhancements to existing tuning features:
- Functional based indexes (FBI)
- KEEP pool replaces "alter table xxx cache" syntax
- Hash and Composite partitioning
- SQL*Loader direct load API (direct=y)
- Online index rebuilds
- Cache Fusion added to Oracle Parallel Server (OPS)
- The Oracle HTTP server allows faster Apache extensions
- Oracle JVM Accelerator
In Oracle 8i, the DBA received STATSPACK, and the whole landscape of
Oracle tuning changed. Now
able to perform historical analysis, the DBA was able to apply
scientific methods to analyze historical performance information.
Oracle 9i
Oracle 9i saw major improvements in performance tuning tools, most
notably STATSPACK, an improvement on the old BSTAT-ESAT utility with
allowed for elapsed-time reports to be stored within the database.
Oracle also introduced "advisory" utilities, tools which showed
the marginal benefits for different SGA pool sizes.
We also saw these important new tuning features:
- Multiple blocksize support
- 64-bit Oracle allows very large SGA sizes
- Separate data buffers allows for segregation of critical tables
& indexes
- Oracle upsert statement improves warehouse loads
- SQL case statement replaces decode syntax
- Oracle external tables allow SQL access to flat files
- Real Application Clusters (RAC) replaces OPS
- List Partitioning and multi-level list-hash partitioning
In Oracle 9i, the major tuning advancements dealt with the management of
very-large data buffers (from 64-bit Oracle releases) and the ability to
segregate critical tables and indexes into separate data buffers.
Oracle 10g
Oracle 10g was a major improvement in all areas of Oracle performance.
The optimizer undertook a major overhaul and the entire kernel
was improved and PL/SQL performance was improved by over 20%.
As the "Grid" database, Oracle re-defined the traditional
definition of grid computing, allowing for blade servers to be genned-in
as needed to accommodate changes in the workload.
We also saw several important tuning features, most importantly
the Automated Workload Repository (AWR) and the Automatic Session
History (ASH) tables:
- Oracle 10g Grid - RAC is enhanced for dynamic
scalability with server blades
- Completely reworked 10g Enterprise Manager (OEM)
- AWR and ASH tables incorporated into OEM Performance Pack and
Diagnostic Pack options
- Automated Session History (ASH) materializes the Oracle Wait
Interface over time
- Automatic Database Diagnostic Monitor (ADDM)
- Automatic Workload Repository (AWR) enhances STATSPACK
- SQLTuning Advisor
- SQLAccess Advisor
Oracle 10g is the age of AWR and ASH, Oracle's codification of their
tuning approaches, and a goldmine for the Oracle professional who wanted
to analyze performance information.
In Oracle 10g release 2, we saw another major tuning improvement,
mutexes. To improve cursor
execution and also hard parsing, a new memory serialization mechanism
has been created in 10gR2. For certain shared-cursor related operations,
mutexes are used as a replacement for library cache latches and library
cache pins. Using mutexes is faster, uses less CPU and also allows
significantly improved concurrency over the existing latch mechanism.
The use of mutexes for cursor pins can be enabled by setting the
init.ora parameter _use_kks_mutex
to TRUE.
Oracle 11g
Oracle 11g was not a revolutionary release for Oracle tuning, but it
concentrated mostly upon improvements to existing features and the
introduction of semi-automated tools to replicate the steps taken by a
human tuning expert. Here
is a list of the major performance tuning new features of Oracle 11g:
- SQL
Performance Analyzer - This is the codification of Oracle's
"holistic" approach, an empirical technique whereby SQL is tuned in
a real-world environment.
Designed to testing silver bullet impact of global changes (init.ora
parameters, new indexes and materialized views, &c), SPA provides
real-world evidence of the performance impact of major changes.
- 11g
Compression - with a late start out of the gate (other DBMS
tools have had compression for decades), Oracle's compression
promises to improve the speed of full-scans operations (important to
batch jobs and data warehouses).
- SQL
optimization improvements - The cost-based optimizer (CBO) is
continuously evolving, and we now see bind peeking fixed and
extended optimizer statistics.
- Automatic
Memory Tuning - Automatic PGA tuning was introduced in Oracle
9i. Automatic SGA tuning was introduced in Oracle 10g. In 11g, all
memory can be tuned automatically by setting one parameter. You
literally tell Oracle how much memory it has and it determines how
much to use for PGA, SGA and OS Processes.
- AWR
Baselines - The AWR baselines of 10g have been extended to allow
automatic creation of baselines for use in other features.
- Adaptive
Metric Baselines - Notification thresholds in 10g were based on
a fixed point. In 11g, notification thresholds can be associated
with a baseline, so the notification thresholds vary throughout the
day in line with the baseline.
Now that we see the evolution of Oracle tuning, let's move on and
explore those tools and techniques which have survived the test of time.
A pragmatic approach to Oracle 11g tuning
Oracle has touted their new 11g "holistic" approach
to SQL tuning as "fully automated SQL tuning", but the marketing hype
must be separated from the reality. The main benefit is that the
DBA can now test changes to global parameters against a real-world
workload, using a SQL Tuning Set (STS). Holistic tuning in Oracle
11g is offered through several functional areas, most importantly the
SQL Performance Advisor (SPA) and the automated SQL Plan Management
(SPM) facility. SPA is the natural evolution of the SQLAccess
advisor:
-
10g SQLAccess Advisor
- The 10g SQL access advisor tests real-world SQL workloads,
recommending missing indexes and materialized views.
-
11g SQL Performance Analyzer
- The SPA takes the SQLAccess advisor one step further and
implements tuning recommendations for any SQL statements that run 3x
faster (when tested with a new workload).
It's important to note that while these tools are brand new, the
techniques have been used for decades to tune large databases.
There are several third-party vendors who sell tools for
capturing workloads, and the expert DBA can lift high-use SQL statements
directly from the v$ views using standard SQL.
In sum, Oracle is attempting to make it easier on the tuning
professional and enforce a "standard" methodology for performance
tuning. Tuning has always
been one of the most complex and challenging areas of database
administration, and Oracle is no exception.
Oracle has often been criticized by neophytes as being "too hard" when
compared to less robust and flexible databases such as SQL Server, but
these noobs fail to appreciate that with great power comes great
complexity.
As the world's
most robust and flexible database, Oracle has been seeking automated
techniques. First we saw
"Oracle Expert" in Oracle 8, a silly tool that often made ludicrous
recommendations. In Oracle
10g we saw extra-cost "performance pack" and "diagnostic pack", which
contained primitive tools for performance forecasting, none of which
could completely replicate a human expert, but are valuable because they
relieve the expert from the tedious, well-structured components of the
tuning process.
Now that we understand the evolution of the tools, let's take a look at
my personal approach, one that does not subscribe to any firm
methodology or tool.
A pragmatic approach to Oracle 11g tuning
With all of these tools and techniques, Oracle professionals are
justifiably confused at the plethora of options.
In the real-world, Oracle professionals recognize the benefits
and limitations of every tuning methodology.
For example, you can always tell a beginner by their use of "absolutes".
For example, a neophyte might say that the data buffer cache hit
ration is completely useless in Oracle tuning, not understanding those
specific times when the database buffer hit ratio is indeed valuable.
(i.e. An OLTP database with an undersized
db_cache_size).
Robin Schumacher (author of the book "Oracle
Performance Troubleshooting" makes the point that a real-world
tuning professional will use any and every tool available.
In essence, Oracle tuning in not a well-structured activity, and it can
never be fully quantified and automated with decision rules.
While it has some well-structured components, human intelligence
is required, and only many years of experience provide the "intuition"
required to understand the complex dynamics of a large production
system. Oracle tuning is
like working on a car while it goes down the freeway at 60 MPH.
Things constantly change, and even the act of measuring
performance can have an impact upon performance.
So, how do we start with Oracle tuning?
It's like the old proverb "You eat an elephant one bite at a
time". Let's take a closer
look at the top-down tuning approach and appreciate the broad-brush
instance tuning that tunes to the workload as a whole.
Once the system is optimized for his workload (be aware that many
systems have multiple workloads), then you can pick-off the outlier SQL
statements and manually tune them.
Dealing with multiple workloads
Using STATSPACK and/or AWR trend analysis, it's easy to identify
time-based processing "signatures", those times when table and index
access patterns change. For
example, it's not uncommon to have bi-modal database, where the database
processes online transactions during office hours.
After the worker go home, batch processing streams begin,
parallel full-scan operations against large tables that are used for
several common purposes:
- Feeding a data warehouse
- Aggregating materialized views
- Creating daily reports
In addition to a "day" and "night" workload, most business database have
end-of-week and end-of-month workloads which may not perform optimally
without changing the CBO statistics and/or init.ora parameters.
Once you have identified each of your workloads you can perform
the above steps to optimize the instance to that workload.
At this point you will have an encapsulated set of parameters and
statistics, which can be rolled-in, just-in-time via Oracle utilities to
ensure that the database morphs just as the new workload patterns
emerge. This is the essence
of creating a self-tuning Oracle database:
1.
Identify repeating signatures to find multiple workloads
2.
Capture a representative workload for each workload
3.
Optimize the instance for each workload
4.
Use dbms_scheduler to morph
the instance immediately preceding the change processing mode
Once you have identified your workload(s), it's time to create the
scientific tests to optimize the instance to the workload.
To illustrate this top-down approach, let's use the 11g "Fully
automated SQL Tuning Features", which closely parallels the actions on a
human tuning expert.
How fully
automated SQL tuning works
In a nutshell, the 11g fully automated SQL tuning is a series of many
processes and tools, loosely coupled for maximum flexibility.
We start by capturing a statistically representative workload(s),
set-up a changed environment (altering only one factor at a time), and
use empirical techniques to run the workload against the new
environment.
This codified approach is a huge improvement over the hit-and-miss SQL
tuning techniques advocated by some of the self-appointed experts on the
Internet, but it's not a truly "fully-automated" approach either.
Oracle tuning has, and always will, required intuition based on
experience tuning hundreds of databases.
Here are step steps described by Oracle Corporation in their
Oracle 11g "fully automated" SQL tuning (remember, it's not fully
automated, since outlier SQL statements must still be manually tuned):
A - The Setup for fully automatic SQL tuning - Here we capture
representative SQL workloads (SQL tuning sets) and set-up a testing
environment:
1 - Define the SQL workload - The DBA defines a "set" of
problematic SQL statements (or chooses a representative workload).
This is called the SQL Tuning set, or STS. This uses the
dbms_sqltune.create_sqlset
package.
2 - Set-up a changed environment - Here you can chose to change
your initialization parms, test your performance against a previous
release of the CBO (a very useful features when testing upgrades) or
conduct "custom experiments" on the effect of environmental changes on
your SQL tuning set.
B - Initial SQL tuning - Using the SQL Performance Analyzer, we
optimize our environment using the SQL tuning set:
1 - Schedule & run workload tests - The workload is scheduled for
execution during "low usage" periods, so that an empirical sample of
real-world execution times can be collected and compared, using
different execution plans from the two SQL tuning sets. To do this
we run the dbms_sqlpa package.
You can also use the OEM SPA "Guided Workflow" wizard.
2 - Implement the changes - For any statements that execute more
then 3x faster, after the changes, Oracle 11g will automatically
implement the changes via "SQL Profiles", a tool that bypasses the
generation of an execution plans for incoming SQL, replacing it with the
pre-tuned access plan.
C - Gather Baseline - Create the SQL Plan Baseline - To enable
automatic SQL plan capture, set the
optimizer_capture_sql_plan_baselines initialization parameter to
TRUE.
D - Regression testing and implementation - We test global
changes with the SQL Plan Manager (SPM). As the system
characteristics change, you can use the SQL Plan Manager to test against
real workloads and ensure that all changed execution plans result in at
least 3x faster performance.
Again, always remember that adjusting global factors (CBO statistics,
init.ora parameters) should only be undertaken when the majority of
production SQL has sub-optimal execution plans.
See my book "Oracle
Tuning: The Definitive Reference" for a complete methodology, but we
must remember these important points:
- Workload-based tuning is
only a starting point, and that there will always be "outlier" SQL
statements that must be tuned manually, often with hints.
- Top-down tuning starts
outside Oracle, by optimizing the server kernel parms and disk I/O
sub-system. On amount
of Oracle tuning can relieve an external bottleneck.
- Reanalyzing CBO statistics
is done with the sole purpose of changing SQL execution plans.
If it ain't broke, don't fix it!
- Oracle has an insatiable
appetite for RAM, but there is a clear point of diminishing marginal
returns as most of the frequently-referenced rows are cached.
The DBA can use the data buffer advisory (v$db_cache_advice)
to find the point of diminishing marginal returns.
Also, with the major server vendors now including solid-state
disk in their server (Sun Microsystems), it only a matter of a few
years until all Oracle data is stored on RAM, and the data buffers
become obsolete.
- There are about a dozen
"silver bullet" parameters which have a profound impact on
performance, both good and bad.
Adjusting these powerful throttles (e.g.
optimizer_index_cost_adj, _optimizer_cost_model) should only be done
by experts, and ONLY after the CBO statistics have been optimized,
especially intelligent histogram placement.
See my book "Oracle Silver Bullets" for a complete
description of this process.
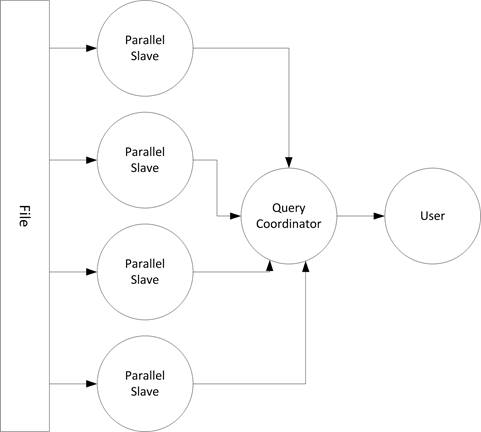
Figure 2: Diminishing marginal returns of pool sizes
Let's take a closer look at the
"changed environment" described in the Oracle 11g documentation.
There are many internal and external factors that influence the elapsed
time for a given SQL statement, and the 11g SQL Performance Analyzer
(SPA) and SQL Plan Management (SPM), the DBA can establish an "optimal
baseline" before diving into the tuning of individual SQL
statements:
-
Optimize the server kernel
- Always tune your disk and network I/O subsystem (RAID, DASD
bandwidth, network) to optimize the I/O time, network packet size
and dispatching frequency. Kernel settings have an indirect effect
on SQL performance. For example, a kernel setting may speed up I/O,
a change which is noted by the CBO workload statistics (using
dbms_stats.gather_workload_stats). This, in turn, directly
influences the optimizer's access decisions.
-
Adjust your optimizer statistics
- Always collect and store optimizer statistics to allow the
optimizer to learn more about the distribution of your data to take
more intelligent SQL access plans. Also, histograms can hypercharge
SQL in cases of determining optimal table join order, and when
making access decisions on skewed WHERE clause predicates. Also new
in 11g, multi-column statistics can be gathered for use by the
optimizer to determine optimal ways to run queries based upon
multiple column criteria.
-
Test patches/new releases
- The Oracle SPA is a great way to remove the guesswork from
migrating to a new release since a representative workload can
quickly identify any resulting changes in execution plans.
This is especially important since Oracle constantly improves
the optimizer and large systems are guaranteed to see changed in SQL
execution as they upgrade to a new release.
-
Adjust optimizer parameters
- You can empirically determine the best settings for
optimizer_mode, _optimizer_cost_model, optimizer_index_cost_adj.
-
Optimize the instance
- Your choice of db_block_size, db_cache_size, and OS
parameters (db_file_multiblock_read_count, cpu_count, etc.)
can influence SQL performance.
-
Tune with indexes and materialized views
- Just as the 10g SQLAccess Advisor recommends missing indexes and
missing materialized views, you should always optimize your SQL
workload with indexes, especially function-based indexes, a godsend
for SQL tuning.
After several iterations of instance tuning (once for each workload),
you will have your environment optimized, and it's now time to
drill-down and pick-off outlier SQL statements.
Individual SQL statement tuning
Now that the majority of SQL has optimal execution plans, it's time to
dive into the tuning of the individual SQL statement.
While there is not space in this short article to completely
describe the SQL tuning process, we can start with a high level overview
of the main steps and important factors.
For my complete methodology, I have a chapter dedicated to this
topic in "Oracle Tuning: The Definitive Reference".
The declarative nature of the SQL syntax has always made it difficult to
perform SQL tuning. The basic tenet of cost-based SQL optimization
is that the person who writes a SQL query simply "declares" what columns
they want to see (the SELECT clause), the tables where the columns
reside (the FROM clause), and the filtering conditions (the WHERE
clause). It's up to the SQL optimizer to always determine the optimal
execution plan. This is a formidable challenge, especially in a
dynamic environment, which is why Oracle introduced the 10g new feature
of CBO dynamic sampling.
SQL tuning is a complex subject and entire books have been dedicated to
the endeavor. In essence,
SQL tuning activities have the following goals:
- Find missing indexes - Replace unnecessary large-table
full-table scans with index scans.
- Buffer up - Cache small-table full table scans
- Best Index - Verify optimal index usage
- Verify optimal table join order
- Verify optimal JOIN techniques
- Tune complex sub-queries to remove redundant access
In Oracle 10g, the new SQL profiles and the SQL Access advisor can be
used to help identify sub-optimal SQL statements.
Once identified, the new Oracle 10g SQL profile utility will allow
changes to execution plans without adding hints.
Despite the inherent complexity of tuning SQL, there are general
guidelines that every Oracle DBA follows in order to improve the overall
performance of their Oracle systems. The goals of SQL tuning are simple:
These goals may seem deceptively simple, but these tasks comprise 90
percent of SQL tuning. They
do not require a thorough understanding of the internals of Oracle SQL.
This venture will begin with an overview of the Oracle SQL optimizers.
The following section will provide a closer look at the goals listed
above as well as how they simplify SQL tuning.
-
Determine optimal table join order
- One of the most common problems with complex SQL is that the
tables are not joined in the optimal order.
Oracle tries to make the first table join (the "driving"
table), produce the smallest number of rows, to reduce the
intermediate row "baggage" that must be input to later table joins.
Extended optimizer statistics, histograms and the ORDERED
hint are great ways to verify optimal table join order.
-
Remove unnecessary large-table full table scans -
Unnecessary full table scans (FTS)
are an important symptom of sub-optimal SQL and cause unnecessary
I/O that can drag down an entire database. The tuning expert first
evaluates the SQL based on the number of rows returned by the query.
The most common tuning tool for addressing unnecessary full table
scans is the addition of indexes, especially function-based indexes.
The decision about removing a full-table scan should be based on a
careful examination of the amount of logical I/O (consistent gets
) of the index scan versus the costs of the full table scan.
-
Cache small-table full table scans -
For cases in which a full table scan is the fastest access method,
the tuning professional should ensure that a dedicated data buffer
is available for the rows. In Oracle 7, an
alter table xxx cache
command can be issued. In Oracle 8 and beyond, the small-table can be
cached by forcing it into the KEEP pool.
-
Logical reads (consistent gets) are often 100x faster than a disk read and small, frequently
referenced objects such as tables, clusters and indexes should be
fully cached in the KEEP pool.
Most DBA's check x$bh
periodically
and move any table that has 80% or more of its blocks in the buffer
into the KEEP pool. In
addition, dba_hist_sqlstat
should be checked for tables
that experience frequent small-table full-table scans.
-
Verify optimal index usage -
Determining the index usage is especially important for improving
the speed of queries with multiple WHERE clause predicates. Oracle
sometimes has a choice of indexes, and the tuning professional must
examine each index and ensure that Oracle is using the best index,
meaning the one that returns the result with the least consistent
gets.
-
Verify optimal JOIN techniques -
Some queries will perform faster with NESTED LOOP joins, some with
HASH joins, while others favor sort-merge joins.
It is difficult to predict what join technique will be
fastest, so many Oracle tuning experts will test run the SQL with
each different table join method.
-
Tuning by Simplifying SQL Syntax -
There are several methods for simplifying complex SQL statements,
and Oracle 10g will sometimes automatically rewrite SQL to make it
more efficient.
- Rewrite the query into a more efficient form
- Use the WITH clause
- Use Global Temporary Tables
- Use Materialized Views
Conclusion
Despite Oracle's claims of "fully automated" SQL tuning, we see that SQL
tuning will always remain a semi-structured task which requires the
intervention of a human expert.
Oracle 11g SQL Performance Analyzer (SPA) is a framework tool
which endorses an empirical approach to SQL tuning, removing the
guesswork from instance tuning by allowing the Oracle professional to
apply a real-world representative workload to the problem domain.
References
- Oracle 11g Performance Tuning Guide, Oracle Corporation, 2015
- Oracle 11g Concepts, Oracle Corporation, 2015
- Oracle Tuning: The Definitive Reference - Donald K. Burleson, Rampant TechPress, 2006
- Oracle Performance Troubleshooting - Robin Schumacher,
Rampant TechPress, 2005
Appendix A - Oracle performance tuning features by
release
Oracle 11g performance tuning features:
- SQL
Performance Analyzer - This is the codification of
Oracle's "holistic" approach, an empirical technique whereby SQL
is tuned in a real-world environment.
Designed to testing silver bullet impact of global
changes (init.ora parameters, new indexes and materialized
views, &c), SPA provides real-world evidence of the performance
impact of major changes.
- 11g Compression - with a late start out of
the gate (other DBMS tools have had compression for decades),
Oracle's compression promises to improve the speed of full-scans
operations (important to batch jobs and data warehouses).
- SQL optimization improvements - The
cost-based optimizer (CBO) is continuously evolving, and we now
see bind peeking fixed and extended optimizer statistics.
- Automatic Memory Tuning - Automatic PGA
tuning was introduced in Oracle 9i. Automatic SGA tuning was
introduced in Oracle 10g. In 11g, all memory can be tuned
automatically by setting one parameter. You literally tell
Oracle how much memory it has and it determines how much to use
for PGA, SGA and OS Processes.
- AWR Baselines - The AWR baselines of 10g
have been extended to allow automatic creation of baselines for
use in other features.
- Adaptive Metric Baselines - Notification
thresholds in 10g were based on a fixed point. In 11g,
notification thresholds can be associated with a baseline, so
the notification thresholds vary throughout the day in line with
the baseline.
New Tuning Enhancements in Oracle 10g release 2:
- Web
server load balancing - The web cache component includes
Apache extension to load-balance transactions to the
least-highly-loaded Oracle HTTP server (OHS).
- RAC
instance load balancing - Staring in Oracle 10g release 2,
Oracle JDBC and ODP.NET provide connection pool load balancing
facilities through integration with the new "load balancing
advisory" tool. This replaces the more-cumbersome
listener-based load balancing technique.
-
Automated Storage Load balancing - Oracle's Automatic
Storage Management (SAM) now enables a single storage pool to be
shared by multiple databases for optimal load balancing. Shared
disk storage resources can alternatively be assigned to
individual databases and easily moved from one database to
another as processing requirements change.
- Data
Guard Load Balancing - Oracle Dataguard allows for load
balancing between standby databases.
-
Listener Load Balancing - If advanced features such as load
balancing and automatic failover are desired, there are optional
sections of the listener.ora file that must be present.
Automatic Storage Management (ASM) includes multiple disk
operations and a non-ASM database migration utility
-
Improved CBO statistics collection - Automated statistics
collection directly from memory designed to eliminate the need
to execute SQL queries
- New administrative reports include automatic database
workload repository comparison
-
Extended use of Standard Chunk sizes - In 10gR2, the server
has been enhanced to further leverage standard chunk allocation
sizes. This additional improvement reduces the number of
problems arising from memory fragmentation.
-
Mutexes - To improve cursor execution and also hard parsing,
a new memory serialization mechanism has been created in 10gR2.
For certain shared-cursor related operations, mutexes are used
as a replacement for library cache latches and library cache
pins. Using mutexes is faster, uses less CPU and also allows
significantly improved concurrency over the existing latch
mechanism. The use of mutexes for cursor pins can be enabled by
setting the init.ora parameter _use_kks_mutex to TRUE.
-
V$SGASTAT - V$SGASTAT has been enhanced to display a finer
granularity of memory to component allocation within the shared
pool. This allows faster diagnosis of memory usage (in prior
releases many smaller allocations were grouped under the
'miscellaneous' heading).
-
V$SQLSTAT - A new view, V$SQLSTAT has been introduced which
contains SQL related statistics (such as CPU time, elapsed time,
sharable memory). This view is very cheap to query even on
high-concurrency systems, as it does not require librarycache
latch use. It contains the most frequently used SQL statistics
in the V$SQL family of views.
-
V$OPEN_CURSOR - This implementation of this view has also
been enhanced to be latchless, making it inexpensive to query.
-
V$SQLAREA - The V$SQLAREA view has been improved in 10gR2;
the view optimizes the aggregation of the SQL statements while
generating the view data.
New
Tuning enhancements in Oracle 10g:
- Oracle 10g Grid - RAC enhanced for Oracle 10g dynamic scalability with server
blades
- Completely
reworked 10g Enterprise Manager (OEM)
- AWR and ASH tables
incorporated into OEM Performance Pack and Diagnostic Pack
options
- Automated Session
History (ASH) materializes the Oracle Wait Interface over
time
- Automatic Database
Diagnostic Monitor (ADDM)
- Automatic Workload
Repository (AWR) enhances STATSPACK
- SQLTuning Advisor
- SQLAccess Advisor
New Tuning enhancements in Oracle 9i :
- Oracle 9i Real
Application Clusters replaces OPS
- Multiple blocksize
support
- New blocksize
parameter for create tablespace syntax
- Oracle upsert
statement introduced
- SQL case statement
replaces decode syntax
- Oracle external
tables
- New v$sql_plan
allows execution plan analysis
- New set autotrace
traceonly explain syntax for SQL*Plus replace explain plan
syntax
- analyze command
and dbms_utility.analyze_schema replaced by dbms_stats
package
- List Partitioning and multi-level list-hash partitioning
New Tuning enhancements in Oracle 8i:
- Oracle HTTP server
gets Apache extensions
- Oracle JVM
Accelerator
- Java Server Pages
(JSP) engine
- New memstat
utility for analyzing Java Memory footprints
- New SQL analytic
Functions (rank, moving average)
- Alter table xxx
storage (freelists) command supported
- Functional based
indexes (FBI)
- MTTR Fast Start
recovery - Checkpoint rate auto-adjusted to match roll
forward criteria
- Online index
rebuilding
- Support for alter
table xxx drop column syntax
- Oracle Parallel
Server (OPS) adds Cache Fusion
- Advanced Queuing
improved
- New execute
immediate syntax
- New dbms_debug
package
- Partitioned tables
enhanced for Hash and Composite partitioning
- SQL*Loader
introduces a direct load API
- dbms_stats
enhanced to allow saving and migration of CBO statistics
analyze table in parallel
New
Tuning enhancements in Oracle 8
- Table Partitioning
and Index partitioning enhancements
- OPS allows
transparent failover to a new node
- reverse key index
supported
- updatable views
- parallel syntax
supported for insert, update and delete DML
- MTS connection
pooling
New
Tuning enhancements in Oracle 7:
- Bitmap Indexes
- Partitioned Views
- Full table scans
support prefetch (asynchronous read ahead)
- alter index xx
rebuild syntax
- Updatable Join
Views
- CBO introduced
histograms for skewed columns and n-way joins
- CBO introduces
hash joins and hash_area_size parameter
- CBO supports
antijoins for NOT subqueries
- dbms_sql package
- Read-only
tablespaces
- Advanced replication
 |
|
Get the Complete
Oracle SQL Tuning Information
The landmark book
"Advanced Oracle
SQL Tuning The Definitive Reference" is
filled with valuable information on Oracle SQL Tuning.
This book includes scripts and tools to hypercharge Oracle 11g
performance and you can
buy it
for 30% off directly from the publisher.
|
|
|


