 |
|
Optimizing Oracle Optimizer Statistics
Oracle Tips by Donald K. Burleson
Updated March 3, 2015
|
In Oracle we now see
11g
extended optimizer statistics, an
alternative to dynamic_sampling for estimating result set
sizes.
The default "For all columns size auto"
It is wasteful to create a histogram on a column that is never
referenced by a SQL statement. The default value of
"for all columns size auto" is the Oracle default and
this option will analyze histograms on what the optimizer
considers to be "important columns". If your
database uses all bind variables, it is best to remove and then
disable all histograms.
The optimizer does this by examining your current workload when
you run the dbms_stats command, interrogating all
current SQL in the library cache to see which columns might
benefit from a histogram.
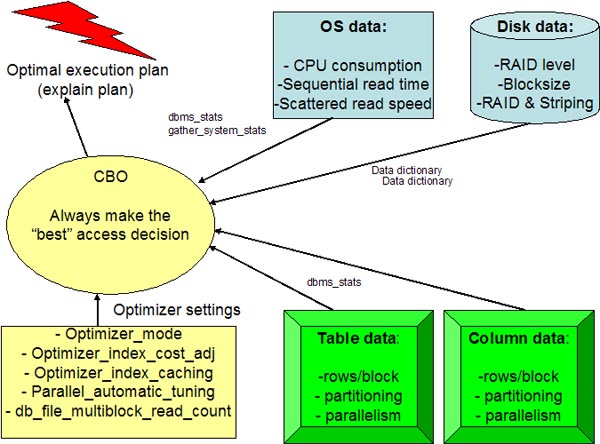
As a review, the CBO gathers information from many sources, and he has
the lofty goal of using DBA-provided metadata to always make the "best"
execution plan decision:
Gathering Optimizer Statistics
Oracle also wants you to
generate system statistics and statistics on fixed tables. In this
section we will look at how you do this. First we will look at
gathering system statistics, and then we will look at how you gather
statistics on fixed tables.
Gathering System
Statistics
The optimizer depends on various inputs, and
one of these is system derived information. This information
includes such things as disk response times and CPU response times.
Oracle Database 10g uses the dbms_stats.gather_system_stats command
to generate system statistics. You generate system statistics under
normal system loads. Generating the statistics is a three stage
process:
* Start collecting statistics
* Run a representative load during the
statistics collection
* Stop collecting statistics
Here is an example of this operation (note
that the -- is a comment):
-- Run
the next statement before you start running the workload
EXECUTE dbms_stats.gather_system_stats('Start');
-- Run
a typical workload here
-- Run
the next statement to stop gathering statistics.
EXECUTE dbms_stats.gather_system_stats('Stop');
You should only need to run this when things
change on your system, such as when you add new disks, adds CPU's or
if the system load changes.
To fully appreciate dbms_stats, you need to
examine each of the major directives. Let's take a close look at
each directive and see how it is used to gather top-quality
statistics for the cost-based SQL optimizer.
The dbms_stats
options parameter
Using one of the four provided methods, this
option governs the way Oracle statistics are refreshed:
* gather—Reanalyzes the whole schema
* gather empty—Only analyzes tables that
have no existing statistics
* gather stale—Only reanalyzes tables with
more than 10% modifications (inserts, updates, deletes).
* gather auto—Reanalyzes objects which
currently have no statistics and objects with stale statistics
(Using gather auto is like combining gather stale and gather empty.)
Note that both gather stale and gather auto
require monitoring. If you issue the alter table xxx monitoring
command, Oracle tracks changed tables with the dba_tab_modifications
view, which allows you to see the exact number of inserts, updates,
and deletes tracked since the last analysis of statistics.
The estimate
percent option
The following
estimate_percent argument is a
new way to allow Oracle's dbms_stats to automatically estimate the
best percentage of a segment to sample when gathering statistics:
estimate_percent =>
dbms_stats.auto_sample_size
You can verify the accuracy of the automatic
statistics sampling by looking at the dba_tables sample_size column.
It is interesting to note that Oracle chooses between 5 and 20
percent for a sample size when using automatic sampling. Remember,
the better the quality of your statistics, the better the decision
of the CBO.
Important!
In 11g and beyond you should not use estimate percent" and let
Oracle default to the automatic sample size. This ensures the
"best" sample size with a minimum amount of time spent analyzing
tables and indexes. S ee these updated notes on
Oracle estimate percent.
The method_opt
option
The method_opt parameter for
dbms_stats is
very useful for refreshing statistics when the table and index data
change. The method_opt parameter is also very useful for determining
which columns require histograms.
In some cases, the distribution of values
within an index will effect the CBOs decision to use an index versus
perform a full-table scan. This happens when a where clause has a
disproportional amount of values, making a full-table scan cheaper
than index access.
Oracle histograms statistics can be created
when you have a highly skewed index, where some values have a
disproportional number of rows. In the real world, this is quite
rare, and one of the most common mistakes with the CBO is the
unnecessary introduction of histograms in the CBO statistics. As a
general rule, histograms are used when a column's values warrant a
change to the execution plan.
To aid in intelligent histogram generation,
Oracle uses the method_opt parameter of dbms_stats. There are also
important new options within the method_opt clause, namely skewonly,
repeat and auto:
method_opt=>'for all indexed columns size
skewonly'
method_opt=>'for all columns size repeat'
method_opt=>'for all columns size auto' -- the 10g default
Parallel
statistics collection
Oracle allows for parallelism when
collecting CBO statistics, which can greatly speed up the time
required to collect statistics. A parallel statistics collection
requires an SMP server with multiple CPUs.
Better execution
speed
The dbms_stats utility is a great way to
improve SQL execution speed. By using dbms_stats to collect
top-quality statistics, the CBO will usually make an intelligent
decision about the fastest way to execute any SQL query. The
dbms_stats utility continues to improve and the exciting new
features of automatic sample size and automatic histogram generation
greatly simplify the job of the Oracle professional.
Many Oracle professional do not realize the important of having
good statistics for the Oracle cost-based SQL optimizer (CBO). The CBO
has received a "bum-rap" from some Oracle professionals who wonder why
the CBO is generating sub-optimal execution plans for their SQL
statements.
If you provide Oracle with good statistics about the schema the CBO
will almost always generate an optimal execution plan. The areas of
schema analysis include:
- Object statistics - Statistics for all tables,
partitions, IOTs, etc should be sampled with a "deep" and
statistically valid sample size.
- Critical columns - Those columns that are
regularly-referenced in SQL statements that are:
- Heavily skewed columns - This helps the CBO properly
choose between an index range scan and a full table scan
- Foreign key columns - For n-way table joins, the CBO
needs to determine the optimal table join order and knowing the
cardinality of the intermediate results sets is critical.
- External statistics - Oracle will sample the CPU cost and
I/O cost during statistics collection and use this information to
determine the optimal execution plan, based on your
optimizer_mode. External statistics are most useful for SQL
running in the all_rows optimizer mode.
Frequency of re-analyze
It astonishes me how many shops prohibit any un-approved production
changes and yet re-analyze schema stats weekly. Evidently, they do not
understand that the purpose of schema re-analysis is to change their
production SQL execution plans, and they act surprised when
performance changes!
Most Oracle experts only recommend scheduled re-analysis for highly
dynamic databases, and most shops save one very-deep sample (with
histograms), storing the statistic with the
dbms_stats.export_schema_stats procedure. The only exceptions are
highly-volatile systems (i.e. lab research systems) where a table is
huge one-day and small the next.
For periodic re-analysis, many shops us the table "monitoring"
option and also method_opt "auto" after they are confident that all
histograms are in-place.
Saving and re-using stats
For data warehouses and database using the
all_rows
optimizer_mode, Oracle9i release 2 has the ability to collect the
external cpu_cost and
io_cost metrics. The ability to
save and re-use schema statistics is important for several types of
Oracle shops:
- Bi-Modal shops - Many shops get huge benefits from using
two sets of stats, one for OLTP (daytime), and another for batch
(evening jobs).
- Test databases - Many Oracle professionals will export
their production statistics into the development instances so that
the test execution plans more closely resemble the production
database.
Getting top-quality stats
Because Oracle schema statistics work best with external system
load, I like to schedule a valid sample (using
dbms_stats.auto_sample_size) during regular working hours. For
example, here we refresh statistics using the "auto" option which
works with the table monitoring facility to only re-analyze those
Oracle tables that have experienced more than a 10% change in row
content:
begin
   dbms_stats.gather_schema_stats(
      ownname          => 'SCOTT',
      estimate_percent => dbms_stats.auto_sample_size,
      method_opt       => 'for all columns size auto',
      degree           => 7
   );
end;
/
Tips for optimizing the CBO with statistics
There are several tips for optimizing your CBO with good
statistics:
- Find skewed columns that are referenced in SQL - Many
shops do not use method_opt=skewonly and suffer from poor execution
plans on skewed column access.
- Find histograms for foreign key columns - Many DBAs
forget that the CBO must have foreign-key histograms in order to
determine the optimal table join order (i.e. the ORDERED hint).
- Fix the cause, not the symptom - For example, whenever I
see a sub-optimal order for table joins, I resist the temptation to
add the ORDERED hint, and instead create histograms on the foreign
keys of the join to force the CBO to make the best decision.
For new features, explore the Oracle10g automatic histogram
collection mechanism that interrogates v$sql_plan to see where
the foreign keys are used. It claims to generate histograms when
appropriate, all automatically.
Oracle guru Guy
Harrison also offers this advice for 11g statistics collection:
"In 11g, I think there are two other ways to get
statistics collected for indexed expressions:
1)
Collect extended statistics directly on the expression.
So for instance, if we had a function SALES_CATEGORY, we might do
this:DBMS_STATS.gather_table_stats
(ownname => USER,
tabname => ‘SALES',
method_opt => ‘FOR ALL
COLUMNS FOR COLUMNS
(sale_category(amount_sold))'
);
2) Create a virtual column on the
expression, then index that column. So for the same
example as above we might create the following virtual column,
then index the column and collect stats as usual:ALTER TABLE
SALES
ADD
sales_category
GENERATED
ALWAYS AS
(sale_category(amount_sold));
I think I like the first method better,
because the statistics will still exist even if the index is
dropped and – unlike the second approach – it doesn't change the
logical structure of the table.
Arup Nanda has a great article on extended statistics with dbms_stats,
specialty histogram analysis using function-based columnar data:
Next, re-gather statistics on the table and collect the
extended statistics on the expression upper(cust_name).
begin
dbms_stats.gather_table_stats (
ownname => 'ARUP',
tabname => 'CUSTOMERS',
method_opt => 'for all columns size skewonly for columns (upper(cust_name))'
);
end;
Alternatively you can define
the column group as part of the gather statistics command.
You do that by placing
these columns in the method_opt parameter of the gather_table_stats procedure in
dbms_stats as shown below:
begin
   dbms_stats.gather_table_stats (
      ownname         => 'ARUP',
      tabname         => 'BOOKINGS',
      estimate_percent=> 100,
      method_opt  => 'FOR ALL COLUMNS SIZE SKEWONLY FOR COLUMNS(HOTEL_ID,RATE_CATEGORY)',
       cascade         => true
|


