For complete details and scripts for viewing disk
I/O metrics in Oracle,
see my book "Oracle
Tuning: The Definitive Reference".One of the
current shortcomings of STATSPACK is that it cannot
directly monitor disk input and output (I/O). Here's a
great technique that I use for extending the
capabilities of Oracle's STATSPACK performance utility
to report statistics on I/O activity at the disk and
file level in a UNIX environment.
Ordinarily, statistics captured by a STATSPACK
snapshot are related only to the read and write activity
at the Oracle data file level. These statistics are
stored in the stats$filestatxs table. Normally,
STATSPACK does not show I/O at the disk or mount point
level, which can be valuable information in determining
hyperactivity on particular files or disks.
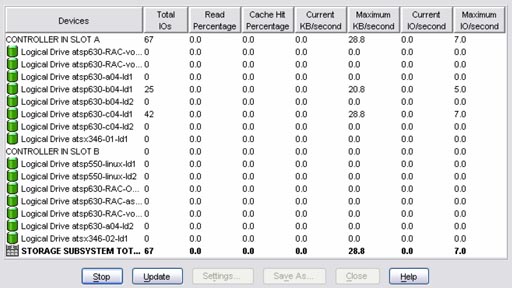
An IBM disk I/O monitor
UNIX, on the other hand, displays read and write I/O
statistics only at the physical disk level, and it's the
responsibility of the Oracle administrator to know what
mount points and disks are used to store the Oracle data
files. If DBAs segregate tables and indexes into
separate tablespaces, they will know which objects
reside in each file, and they can tell which tables and
indexes are experiencing high I/O rates.
Instead of using standard utilities to generate a report
for a single time period, you can modify utilities to
collect I/O data over consistent intervals, storing the
results in Oracle tables for easy access and reporting.
The following is an outline of requirements:
- File-level statistics?As mentioned, the
STATSPACK stats$filestatxs table contains I/O
data collected by snapshots taken at consistent
intervals. I/O data captured includes the actual
number of physical reads, physical writes, block
reads, block writes, and the time required for each
operation.
- Disk-level statistics?By extending
STATSPACK to capture disk I/O from the UNIX iostat
command and placing the data in a newly created
STATSPACK extension table (stats$iostat), we
create a repository for expanded data reporting. The
stats$iostat table will contain overall
disk-level read and write information with
corresponding timestamps. Using a script, we call
get_iostat.ksh, and we collect the disk-level
information displayed by the iostat command at
regular intervals and insert it into the
stats$iostat table.
Below is the sample script that I use in Solaris.
Additionally, a cross-reference table (stats$vol_grp)
between the stats$filestatxs and stats$iostat
tables, could be created, linking mount points to
physical disks. You would need to populate this table
manually, according to how disks are partitioned into
mount points. The design of these tables lets you
aggregate, or average, I/O data over time and create
summaries by disk, mount point, tablespace, or datafile.
#!/bin/ksh
while true
do
iostat -x 300
1|\
sed 1,2d|\
awk '{
printf("%s %s %s\n", $1, $4, $5) }' |\
while read
HDISK VMSTAT_IO_R VMSTAT_IO_W
do
if [ $VMSTAT_IO_R
-gt 0 ] and [ $VMSTAT_IO_W -gt 0 }
then
sqlplus -s
perfstat/perfstat <<!
insert
into perfstat.stats\$iostat
values
(SYSDATE,
5, '$HDISK', $VMSTAT_IO_R, $VMSTAT_IO_W);
exit
!
fi
done
sleep 300
done
Specific I/O
activity
When the DBA prudently segregates Oracle objects into
distinct datafiles and tablespaces, STATSPACK can be
used to create useful reports showing individual I/O,
selected datafiles, or groups of related datafiles. For
example, the script in Listing B uses a filename "mask"
to report on selected groups of related datafiles.
If we
have purposefully named our customer-related datafilescustomer.dbf,
custhistory.dbf, and custorders.dbf, we
can use this script to report the I/O history on all
datafile names that contain the string "cust".
set pages 9999;
column filename
format a40
column mydate
heading 'Yr. Mo Dy ' format a16
select
to_char(snap_time,'yyyy-mm-dd')
mydate,
sum(new.phyrds-old.phyrds) phy_rds,
sum(new.phywrts-old.phywrts) phy_wrts
from
perfstat.stats$filestatxs
old,
perfstat.stats$filestatxs
new,
perfstat.stats$snapshot sn
where
new.snap_id =
sn.snap_id
and
old.filename =
new.filename
and
old.snap_id =
sn.snap_id-1
and
(new.phyrds-old.phyrds)
> 0
and
old.filename
like '%&1%'
group by
to_char(snap_time,'yyyy-mm-dd'),
old.filename;
The output from this script shows the total
read and write I/O per day for our custdatafiles. In
order to better visualize what the report is telling
us, we can graph the statistics using Excel's chart
wizard, as shown below. By viewing the output
graphically, we can often recognize patterns of activity
called I/O signatures, which are useful in file load
balancing.
Yr. Mo Dy
PHY_RDS PHY_WRTS
----------------
---------- ----------
2002-12-18 7 226
2002-12-19 87 556
2002-12-20 141 640
2002-12-21 26 452
2002-12-22 45 368
2002-12-23 10 115
2002-12-24 3 14
2002-12-25 5 54
2002-12-26 169 509
2002-12-27 14 101
2002-12-28 25 316
2002-12-29 13 132
2002-12-30 7 158
2002-12-31 2 129
2015-01-01 4 264
2015-01-02 57 756
2015-01-03 56 317
2015-01-04 1110 123
2015-01-05 1075 386
2015-01-06 20 293
2015-01-07 1 6
2015-01-08 955 1774
2015-01-09 247 1145
2015-01-10 538 1724
2015-01-11 387 1169
2015-01-12 1017 1964
2015-01-13 115 397
2015-01-14 89 443
2015-01-15 22 125
2015-01-16 1267 1667
2015-01-17 646 2082
2015-01-18 588 2359

The script below uses the newly captured disk-level
statistics to display the sum of disk I/O by day, hour,
or collection interval (five minutes in our earlier
script). Notice how the script time interval can be
selected via un-commenting appropriate lines of code.
Here we see a partial listing of the report
generated here.
column hdisk
format a10;
column mydate
format a15;
column
sum_kb_read format 999,999;
column
sum_kb_write format 999,999;
set pages 999;
break on hdisk
skip 1;
select
hdisk,
-- to_char(snap_time,'yyyy-mm-dd
HH24:mi:ss') mydate,
to_char(snap_time,'yyyy-mm-dd
HH24') mydate,
-- to_char(snap_time,'day')
mydate,
sum(kb_read) sum_kb_read,
sum(kb_write)
sum_kb_write
from
stats$iostat
group by
hdisk
-- ,to_char(snap_time,'day')
-- ,to_char(snap_time,'yyyy-mm-dd
HH24:mi:ss')
,to_char(snap_time,'yyyy-mm-dd
HH24')
;
HDISK
MYDATE SUM_KB_READ SUM_KB_WRITE
----------
--------------- ----------- ------------
atf0
2002-12-26 21 9 477
2002-12-26 22 12 636
2002-12-26 23 112 14636
2002-12-27 07 382 3636
2002-12-27 08 433 641
atf2
2002-12-26 21 0 4
atf4
2002-12-26 21 9 90
2002-12-26 22 12 120
2002-12-26 23 132 5655
Unlimited
enhancements
I've provided a brief introduction to how the standard
STATSPACK utility can be extended to collect and report
on additional UNIX-provided information.
Enhancing the
reporting capabilities of STATSPACK is bound only by the
imagination of the DBA in search of automating mundane
tasks while providing timely and useful information.
|
|
|
|
|
Oracle Training from Don Burleson
The best on site
"Oracle
training classes" are just a phone call away! You can get personalized Oracle training by Donald Burleson, right at your shop!

|
|
|
|
